

320
Isabel Serrasolses and V. Ramon Vallejo
ashbed+H layer, whereas after the heavy rains only 15% of the sampling
points conserved these materials. Part of the ashes and H layer were mixed
with the top mineral soil. Assuming that all the organic C of these layers was
incorporated into the 0-5 em mineral soil, the resulting enrichment of organic C in the upper mineral soil should be around 1 % of the soil weight, i.e.
undetectable given the high spatial variability of this layer.
The soil losses collected in Gerlach channels located at the bottom of the
plots (Soler et al. 1994) were much higher during the heavy rain events than
they had been in the previous period. However, during the first post-fire year
the eroded sediment totalled only 363 kg ha- I year-I when referred to the total
area of the strip of burnt plot upslope of each Gerlach channel. The sediments
collected in the Gerlach channels came, though, from upslope distances of less
than 6 m. If the collected sediments are thus referred to the area enclosed by
this length, soil losses would amount to 2.4 Mg ha- I year-I. Both results fall
within the low range for erosion rates observed in the literature (DeBano et al.
1979; Soto 1993). These soils present low erodibility, in agreement with their
high infiltration capacity and structural stability (Josa et al.1994).
The L layer in the burned plot began to be reconstructed in the second
year after the fire. After 2.3 years, the L weight was similar to the pre-fire
weight, but was now more greatly enriched with Cistus albidus litter in addition to holm oak. Ferran and Vallejo (1992) also found that the weight of L
required 2 years to recover in burned holm oak forests, and estimated 23
years for the reconstruction of the F layer weight.
22.5 Nutrient Dynamics in the Forest Floor
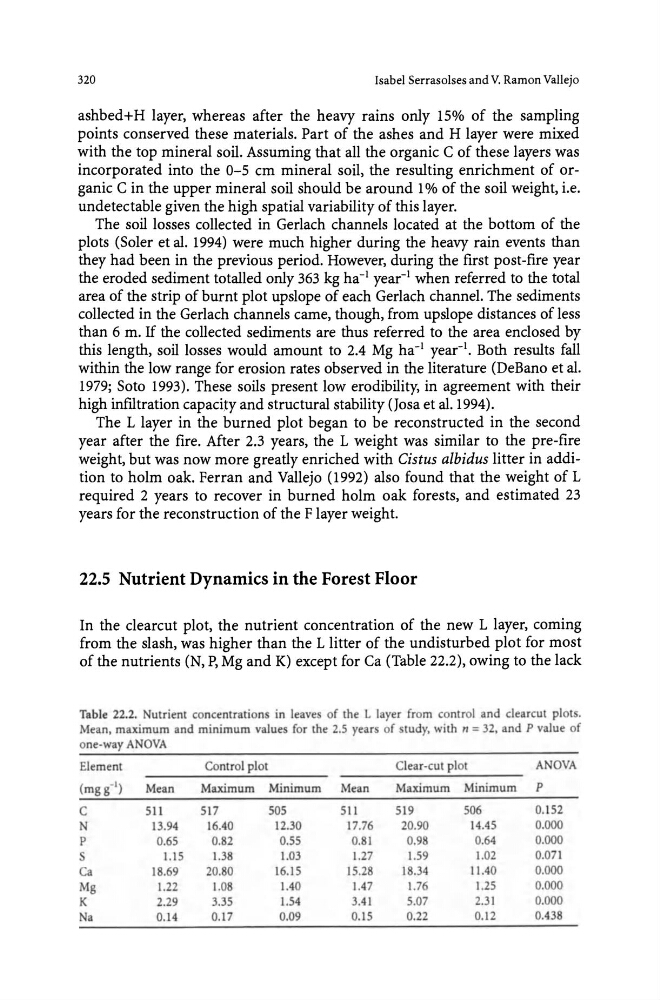
In the clearcut plot, the nutrient concentration of the new L layer, coming
from the slash, was higher than the L litter of the undisturbed plot for most
of the nutrients (N, P, Mg and K) except for Ca (Table 22.2), owing to the lack
Table 22.2. Nutrient concentrations in leaves of the L layer from control and clearcut plot .
Mean. maximum and minimum value for the 2.5 year of tudy. with n = 32. and P value of
one-way ANOVA
Element
Control plot
Clear-cut plot
A OVA
(mgg- I )
Mean
Maximum Minimum
Mean
Maximum Minimum
P
C
511
517
505
511
519
506
0.152
13.94
16.40
12.30
17.76
20.90
14.45
0.000
P
0.65
0.82
0.55
0.81
0.98
0.64
0.000
1.15
1.38
1.03
1.27
1.59
1.02
0.071
Ca
18.69
20.80
16.1 5
15.28
18.34
11.40
0.000
Mg
1.22
1.08
1.40
1.47
1.76
1.25
0.000
K
2.29
3.35
1.54
3.41
5.07
2.31
0.000
a
0.14
0.17
0.09
0.15
0.22
0. 12
0.438
Isabel Serrasolses and V. Ramon Vallejo
ashbed+H layer, whereas after the heavy rains only 15% of the sampling
points conserved these materials. Part of the ashes and H layer were mixed
with the top mineral soil. Assuming that all the organic C of these layers was
incorporated into the 0-5 em mineral soil, the resulting enrichment of organic C in the upper mineral soil should be around 1 % of the soil weight, i.e.
undetectable given the high spatial variability of this layer.
The soil losses collected in Gerlach channels located at the bottom of the
plots (Soler et al. 1994) were much higher during the heavy rain events than
they had been in the previous period. However, during the first post-fire year
the eroded sediment totalled only 363 kg ha- I year-I when referred to the total
area of the strip of burnt plot upslope of each Gerlach channel. The sediments
collected in the Gerlach channels came, though, from upslope distances of less
than 6 m. If the collected sediments are thus referred to the area enclosed by
this length, soil losses would amount to 2.4 Mg ha- I year-I. Both results fall
within the low range for erosion rates observed in the literature (DeBano et al.
1979; Soto 1993). These soils present low erodibility, in agreement with their
high infiltration capacity and structural stability (Josa et al.1994).
The L layer in the burned plot began to be reconstructed in the second
year after the fire. After 2.3 years, the L weight was similar to the pre-fire
weight, but was now more greatly enriched with Cistus albidus litter in addition to holm oak. Ferran and Vallejo (1992) also found that the weight of L
required 2 years to recover in burned holm oak forests, and estimated 23
years for the reconstruction of the F layer weight.
22.5 Nutrient Dynamics in the Forest Floor
In the clearcut plot, the nutrient concentration of the new L layer, coming
from the slash, was higher than the L litter of the undisturbed plot for most
of the nutrients (N, P, Mg and K) except for Ca (Table 22.2), owing to the lack
Table 22.2. Nutrient concentrations in leaves of the L layer from control and clearcut plot .
Mean. maximum and minimum value for the 2.5 year of tudy. with n = 32. and P value of
one-way ANOVA
Element
Control plot
Clear-cut plot
A OVA
(mgg- I )
Mean
Maximum Minimum
Mean
Maximum Minimum
P
C
511
517
505
511
519
506
0.152
13.94
16.40
12.30
17.76
20.90
14.45
0.000
P
0.65
0.82
0.55
0.81
0.98
0.64
0.000
1.15
1.38
1.03
1.27
1.59
1.02
0.071
Ca
18.69
20.80
16.1 5
15.28
18.34
11.40
0.000
Mg
1.22
1.08
1.40
1.47
1.76
1.25
0.000
K
2.29
3.35
1.54
3.41
5.07
2.31
0.000
a
0.14
0.17
0.09
0.15
0.22
0. 12
0.438