

Biogeochemical Models
~
c- 0)
~
«I
U
a
~
c- O)
~
.~
c:
iii
~
«
b
Streamwater. Precipitation increase
400 ~----------------------------------~
300
w
b
h
200
100 4---~r----r----.----.----'---~r---~
1800 1850 1900 1950 2000 2050 2100 2150
Streamwater. Precipitation increase
650 ,--------------------------------.
575
500
425
w
b
h
350 ~--_.----,_--_.----,_--_.----,_--~
1800 1850 1900 1950 2000 2050 2100 2150
Year
307
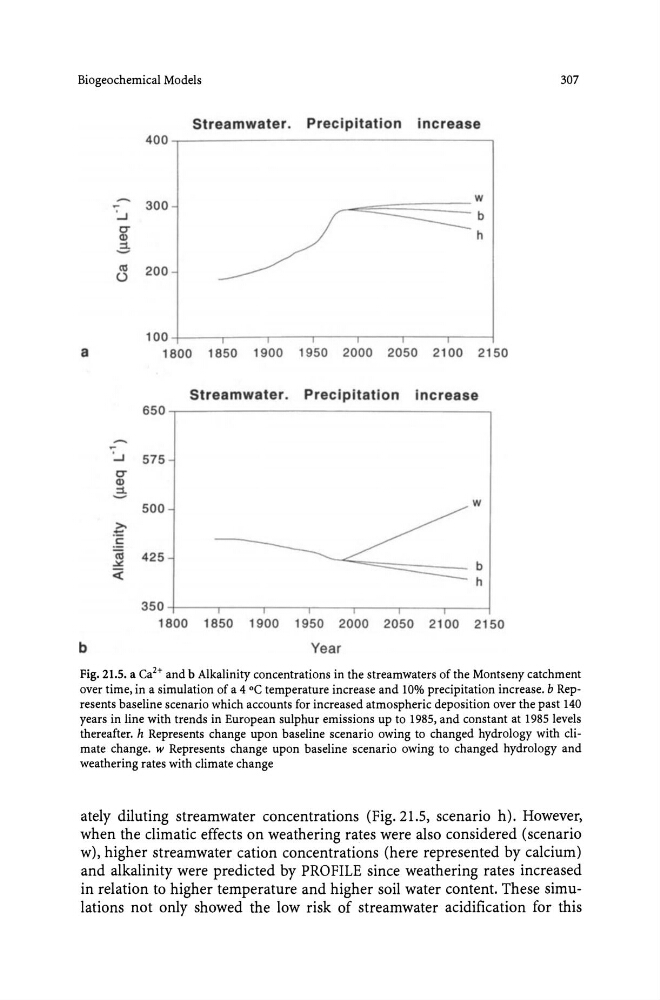
Fig. 21.5. a Ca 2 + and b Alkalinity concentrations in the streamwaters of the Montseny catchment
over time, in a simulation of a 4 °C temperature increase and 10% precipitation increase. b Represents baseline scenario which accounts for increased atmospheric deposition over the past 140
years in line with trends in European sulphur emissions up to 1985, and constant at 1985 levels
thereafter. h Represents change upon baseline scenario owing to changed hydrology with climate change. w Represents change upon baseline scenario owing to changed hydrology and
weathering rates with climate change
ately diluting streamwater concentrations (Fig. 21.5, scenario h), However,
when the climatic effects on weathering rates were also considered (scenario
w), higher streamwater cation concentrations (here represented by calcium)
and alkalinity were predicted by PROFILE since weathering rates increased
in relation to higher temperature and higher soil water content. These simulations not only showed the low risk of streamwater acidification for this
~
c- 0)
~
«I
U
a
~
c- O)
~
.~
c:
iii
~
«
b
Streamwater. Precipitation increase
400 ~----------------------------------~
300
w
b
h
200
100 4---~r----r----.----.----'---~r---~
1800 1850 1900 1950 2000 2050 2100 2150
Streamwater. Precipitation increase
650 ,--------------------------------.
575
500
425
w
b
h
350 ~--_.----,_--_.----,_--_.----,_--~
1800 1850 1900 1950 2000 2050 2100 2150
Year
307
Fig. 21.5. a Ca 2 + and b Alkalinity concentrations in the streamwaters of the Montseny catchment
over time, in a simulation of a 4 °C temperature increase and 10% precipitation increase. b Represents baseline scenario which accounts for increased atmospheric deposition over the past 140
years in line with trends in European sulphur emissions up to 1985, and constant at 1985 levels
thereafter. h Represents change upon baseline scenario owing to changed hydrology with climate change. w Represents change upon baseline scenario owing to changed hydrology and
weathering rates with climate change
ately diluting streamwater concentrations (Fig. 21.5, scenario h), However,
when the climatic effects on weathering rates were also considered (scenario
w), higher streamwater cation concentrations (here represented by calcium)
and alkalinity were predicted by PROFILE since weathering rates increased
in relation to higher temperature and higher soil water content. These simulations not only showed the low risk of streamwater acidification for this