

306
'..J
r::r
Q)
.=;
<13
U
a
' ....J
r::r
Q)
~
2!'
'c
Cii
..:.::
~
b
Streamwater. Precipitation decrease
450
h
400
350
300
b
250
200
150
100 +----,----.----.----.----,r----r--~
1800 1850 1900 1950 2000 2050 2100 2150
Streamwater. Precipitation decrease
650 .-------------------------------~
550
h
450
b
350 4----.----,---,----,----,---,----,
1800 1850 1900 1950 2000 2050 2100 2150
Year
Anna Avila
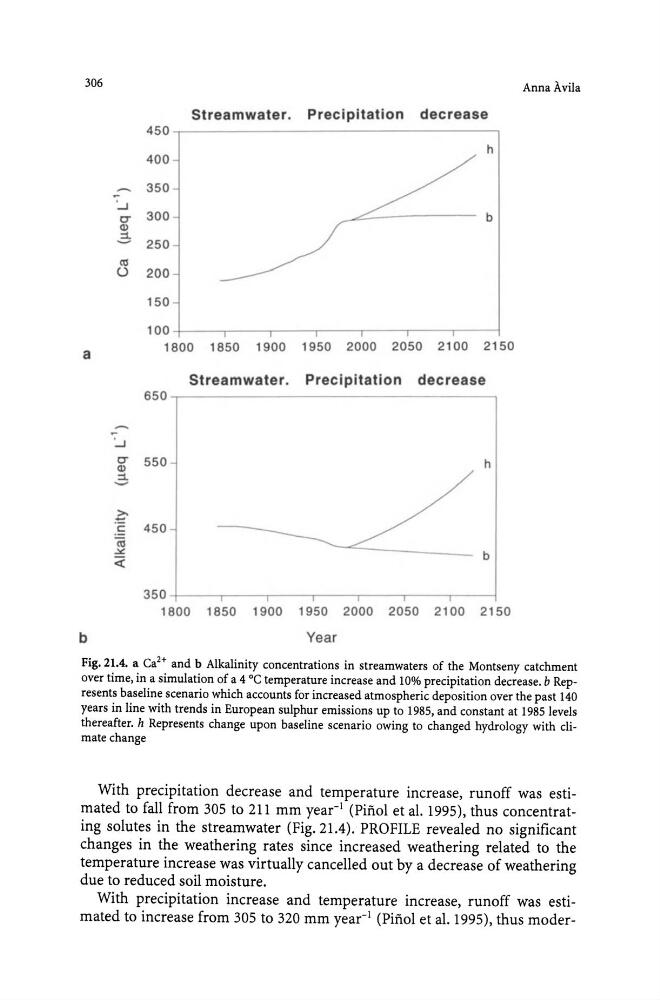
Fig. 21.4. a Ca 2 + and b Alkalinity concentrations in streamwaters of the Montseny catchment
over time, in a simulation of a 4 °C temperature increase and 10% precipitation decrease. b Represents baseline scenario which accounts for increased atmospheric deposition over the past 140
years in line with trends in European sulphur emissions up to 1985, and constant at 1985 levels
thereafter. h Represents change upon baseline scenario owing to changed hydrology with climate change
With preCIpItation decrease and temperature increase, runoff was estimated to fall from 305 to 211 mm year- 1 (Pifiol et al. 1995), thus concentrating solutes in the streamwater (Fig. 21.4). PROFILE revealed no significant
changes in the weathering rates since increased weathering related to the
temperature increase was virtually cancelled out by a decrease of weathering
due to reduced soil moisture.
With precipitation increase and temperature increase, runoff was estimated to increase from 305 to 320 mm year- 1 (Pifiol et al. 1995), thus moder-
'..J
r::r
Q)
.=;
<13
U
a
' ....J
r::r
Q)
~
2!'
'c
Cii
..:.::
~
b
Streamwater. Precipitation decrease
450
h
400
350
300
b
250
200
150
100 +----,----.----.----.----,r----r--~
1800 1850 1900 1950 2000 2050 2100 2150
Streamwater. Precipitation decrease
650 .-------------------------------~
550
h
450
b
350 4----.----,---,----,----,---,----,
1800 1850 1900 1950 2000 2050 2100 2150
Year
Anna Avila
Fig. 21.4. a Ca 2 + and b Alkalinity concentrations in streamwaters of the Montseny catchment
over time, in a simulation of a 4 °C temperature increase and 10% precipitation decrease. b Represents baseline scenario which accounts for increased atmospheric deposition over the past 140
years in line with trends in European sulphur emissions up to 1985, and constant at 1985 levels
thereafter. h Represents change upon baseline scenario owing to changed hydrology with climate change
With preCIpItation decrease and temperature increase, runoff was estimated to fall from 305 to 211 mm year- 1 (Pifiol et al. 1995), thus concentrating solutes in the streamwater (Fig. 21.4). PROFILE revealed no significant
changes in the weathering rates since increased weathering related to the
temperature increase was virtually cancelled out by a decrease of weathering
due to reduced soil moisture.
With precipitation increase and temperature increase, runoff was estimated to increase from 305 to 320 mm year- 1 (Pifiol et al. 1995), thus moder-