

Element Budgets in Catchments
287
20.3.2 Element Outputs in Streamwater
Element outputs were computed analogously to inputs by multiplying the
weekly element concentrations by the amount of runoff corresponding to
each sample. While, as seen in the previous section, the chemistry of the
Prades and Montseny streamwaters was quite contrasted, the differences
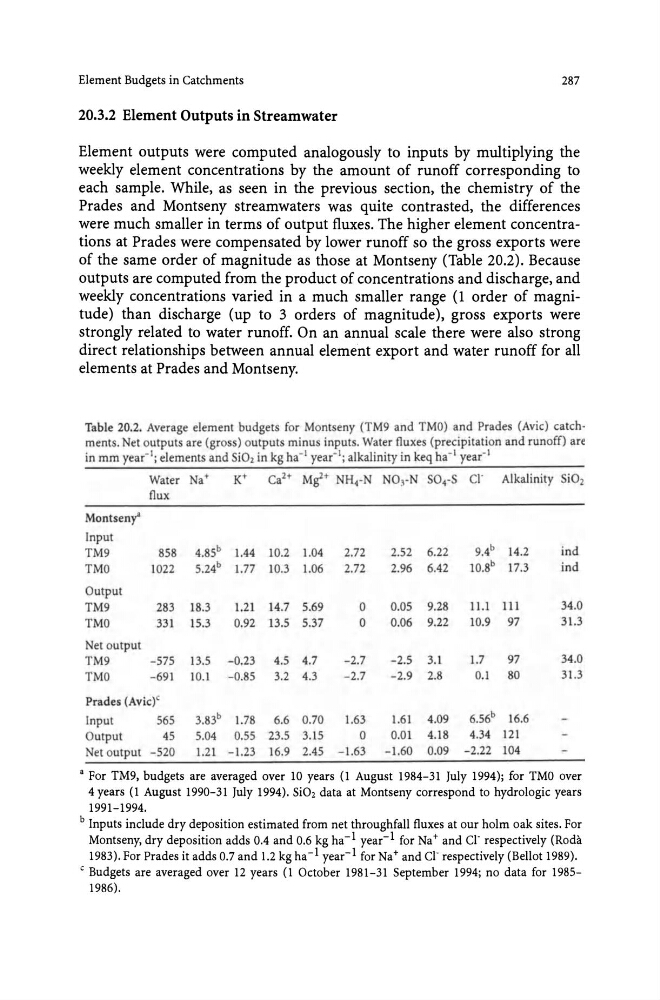
were much smaller in terms of output fluxes. The higher element concentrations at Prades were compensated by lower runoff so the gross exports were
of the same order of magnitude as those at Montseny (Table 20.2). Because
outputs are computed from the product of concentrations and discharge, and
weekly concentrations varied in a much smaller range (1 order of magnitude) than discharge (up to 3 orders of magnitude), gross exports were
strongly related to water runoff. On an annual scale there were also strong
direct relationships between annual element export and water runoff for all
elements at Prades and Montseny.
Table 20.2. Average element budgets for Montseny (TM9 and TMO) and Prades (Avic) catchments. Net outputs are (gross) outputs minus inputs. Water fluxes (precipitation and runoff) are
in mm year- I; elements and SiOl in kg ha- I year- I; alkalinity in keq ha- 1 year-I
Water Na+
Kt
ca2-t Mit NH4-N NO)- N S04-S n Alkalinity Si02
flux
Montseny"
Input
9.4 b
TM9
858
4-85 b 1.44 10.2 1.04
2.72
2.52 6.22
14.2
ind
TMO
1022
5.24 b 1.77 10.3 1.06
2.72
2.96 6.42
10.8 b 17.3
ind
Output
TM9
283 18.3
1.21 14.7 5.69
0
0.05 9.28
11.1 III
34.0
TMO
331 15.3
0.92 13.5 5.37
0
0.06 9.22
10.9 97
31.3
Net output
TM9
-575 13.5 -0.23
4.5 4.7
-2.7
-2.5 3.1
1.7
97
34.0
TMO
-691 10.1 - 0.85
3.2 4.3
-2.7
-2.9 2.8
0.1
80
31.3
Prades (Avic)C
Input
565
3.83 b 1.78
6.6 0.70
1.63
1.61 4.09
6.56 b 16.6
Output
45
5.04 0.55 23.5 3.15
0
0.01 4.18
4.34 121
Net output -520
1.21 - 1.23 16.9 2.45 -1.63
-1.60 0.09 -2.22 104
a For TM9, budgets are averaged over 10 years (I August 1984-31 July 1994); for TMO over
4 years (I August 1990-31 July 1994). Si02 data at Montseny correspond to hydrologic years
1991-1994.
b Inputs include dry deposition estimated from net throughfall fluxes at our holm oak sites. For
Montseny, dry deposition adds 0.4 and 0.6 kg ha- 1 year- 1 for Na+ and CI' respectively (Rodil
1983). For Prades it adds 0.7 and 1.2 kg ha- 1 year- 1 for Na+ and Cl' respectively (Bellot 1989).
C Budgets are averaged over 12 years (I October 1981-31 September 1994; no data for 19851986).
287
20.3.2 Element Outputs in Streamwater
Element outputs were computed analogously to inputs by multiplying the
weekly element concentrations by the amount of runoff corresponding to
each sample. While, as seen in the previous section, the chemistry of the
Prades and Montseny streamwaters was quite contrasted, the differences
were much smaller in terms of output fluxes. The higher element concentrations at Prades were compensated by lower runoff so the gross exports were
of the same order of magnitude as those at Montseny (Table 20.2). Because
outputs are computed from the product of concentrations and discharge, and
weekly concentrations varied in a much smaller range (1 order of magnitude) than discharge (up to 3 orders of magnitude), gross exports were
strongly related to water runoff. On an annual scale there were also strong
direct relationships between annual element export and water runoff for all
elements at Prades and Montseny.
Table 20.2. Average element budgets for Montseny (TM9 and TMO) and Prades (Avic) catchments. Net outputs are (gross) outputs minus inputs. Water fluxes (precipitation and runoff) are
in mm year- I; elements and SiOl in kg ha- I year- I; alkalinity in keq ha- 1 year-I
Water Na+
Kt
ca2-t Mit NH4-N NO)- N S04-S n Alkalinity Si02
flux
Montseny"
Input
9.4 b
TM9
858
4-85 b 1.44 10.2 1.04
2.72
2.52 6.22
14.2
ind
TMO
1022
5.24 b 1.77 10.3 1.06
2.72
2.96 6.42
10.8 b 17.3
ind
Output
TM9
283 18.3
1.21 14.7 5.69
0
0.05 9.28
11.1 III
34.0
TMO
331 15.3
0.92 13.5 5.37
0
0.06 9.22
10.9 97
31.3
Net output
TM9
-575 13.5 -0.23
4.5 4.7
-2.7
-2.5 3.1
1.7
97
34.0
TMO
-691 10.1 - 0.85
3.2 4.3
-2.7
-2.9 2.8
0.1
80
31.3
Prades (Avic)C
Input
565
3.83 b 1.78
6.6 0.70
1.63
1.61 4.09
6.56 b 16.6
Output
45
5.04 0.55 23.5 3.15
0
0.01 4.18
4.34 121
Net output -520
1.21 - 1.23 16.9 2.45 -1.63
-1.60 0.09 -2.22 104
a For TM9, budgets are averaged over 10 years (I August 1984-31 July 1994); for TMO over
4 years (I August 1990-31 July 1994). Si02 data at Montseny correspond to hydrologic years
1991-1994.
b Inputs include dry deposition estimated from net throughfall fluxes at our holm oak sites. For
Montseny, dry deposition adds 0.4 and 0.6 kg ha- 1 year- 1 for Na+ and CI' respectively (Rodil
1983). For Prades it adds 0.7 and 1.2 kg ha- 1 year- 1 for Na+ and Cl' respectively (Bellot 1989).
C Budgets are averaged over 12 years (I October 1981-31 September 1994; no data for 19851986).