

264
Antoni Escarre, Ferran Roda, Jaume Terradas and Xavier Mayor
biogeochemical trends within and among biomes, we conducted a principal
component analysis of forest stands described by their nutrient fluxes. We
used 31 forest stands: our two holm oak sites plus 29 stands from the appendix of Cole and Rapp (1981), one of which was also a holm oak forest (Le
Rouquet, southern France). The 16 variables used were the dry weight of litterfall and nutrient (N, P, K, Ca, Mg) fluxes (kg ha- 1 year-I) in the annual production of leaves, in the current annual production of branches+boles, and
in litterfall. These variables were chosen to reflect the intensity of nutrient
cycling in a forest ecosystem. Variables related to tree nutrient content were
not included because they depend heavily on stand biomass. Of the 32 stands
listed by Cole and Rapp (1981), we retained 29 having complete data for all
16 variables.
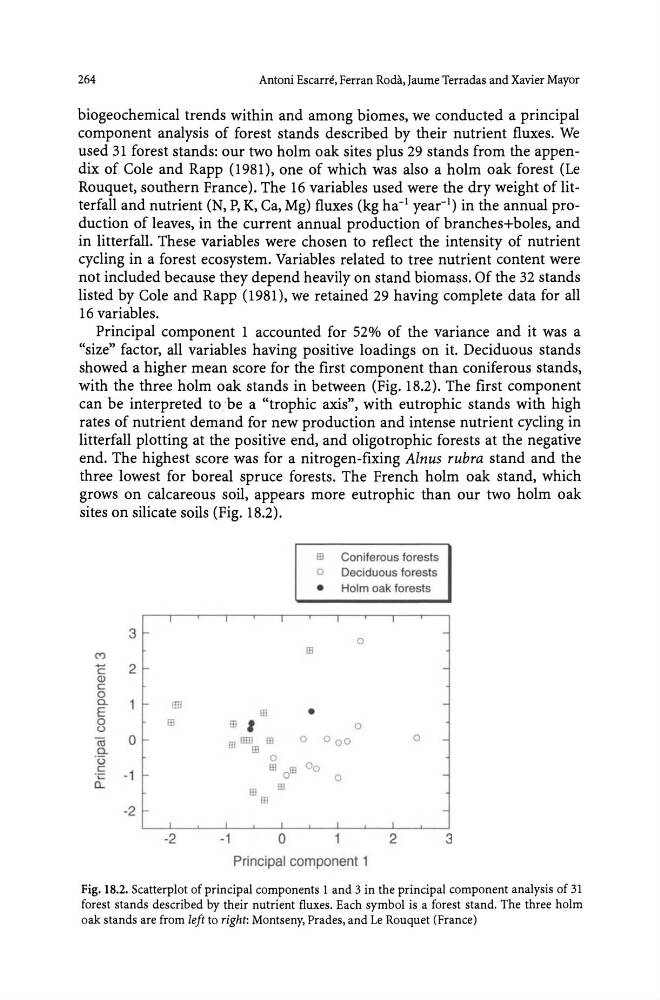
Principal component 1 accounted for 52% of the variance and it was a
"size" factor, all variables having positive loadings on it. Deciduous stands
showed a higher mean score for the first component than coniferous stands,
with the three holm oak stands in between (Fig. 18.2). The first component
can be interpreted to,'be a "trophic axis", with eutrophic stands with high
rates of nutrient demand for new production and intense nutrient cycling in
litterfall plotting at the positive end, and oligotrophic forests at the negative
end. The highest score was for a nitrogen-fixing Alnus rubra stand and the
three lowest for boreal spruce forests. The French holm oak stand, which
grows on calcareous soil, appears more eutrophic than our two holm oak
sites on silicate soils (Fig. 18.2).
EB
Coniferous forests
o
Deciduous forests
•
Holm oak forests
3
o
C")
EB
E
2
Q)
c:
0
a.
E
EB
•
0
u
m
EB ,
0
m 0
a.
EB IIIIl 8l
0
000
0
-
IE
'(3
c:
- 1
;t
0
EB
dB
0 0
0
-
III
!B
Ell
-2
-
-2
-1
0
2
3
Principal component 1
Fig. 18.2. Scatterplot of principal components 1 and 3 in the principal component analysis of 31
forest stands described by their nutrient fluxes. Each symbol is a forest stand. The three holm
oak stands are from left to right: Montseny, Prades, and Le Rouquet (France)
Antoni Escarre, Ferran Roda, Jaume Terradas and Xavier Mayor
biogeochemical trends within and among biomes, we conducted a principal
component analysis of forest stands described by their nutrient fluxes. We
used 31 forest stands: our two holm oak sites plus 29 stands from the appendix of Cole and Rapp (1981), one of which was also a holm oak forest (Le
Rouquet, southern France). The 16 variables used were the dry weight of litterfall and nutrient (N, P, K, Ca, Mg) fluxes (kg ha- 1 year-I) in the annual production of leaves, in the current annual production of branches+boles, and
in litterfall. These variables were chosen to reflect the intensity of nutrient
cycling in a forest ecosystem. Variables related to tree nutrient content were
not included because they depend heavily on stand biomass. Of the 32 stands
listed by Cole and Rapp (1981), we retained 29 having complete data for all
16 variables.
Principal component 1 accounted for 52% of the variance and it was a
"size" factor, all variables having positive loadings on it. Deciduous stands
showed a higher mean score for the first component than coniferous stands,
with the three holm oak stands in between (Fig. 18.2). The first component
can be interpreted to,'be a "trophic axis", with eutrophic stands with high
rates of nutrient demand for new production and intense nutrient cycling in
litterfall plotting at the positive end, and oligotrophic forests at the negative
end. The highest score was for a nitrogen-fixing Alnus rubra stand and the
three lowest for boreal spruce forests. The French holm oak stand, which
grows on calcareous soil, appears more eutrophic than our two holm oak
sites on silicate soils (Fig. 18.2).
EB
Coniferous forests
o
Deciduous forests
•
Holm oak forests
3
o
C")
EB
E
2
Q)
c:
0
a.
E
EB
•
0
u
m
EB ,
0
m 0
a.
EB IIIIl 8l
0
000
0
-
IE
'(3
c:
- 1
;t
0
EB
dB
0 0
0
-
III
!B
Ell
-2
-
-2
-1
0
2
3
Principal component 1
Fig. 18.2. Scatterplot of principal components 1 and 3 in the principal component analysis of 31
forest stands described by their nutrient fluxes. Each symbol is a forest stand. The three holm
oak stands are from left to right: Montseny, Prades, and Le Rouquet (France)