

Nutrient Distribution and Cycling
261
18.5 Nutrient Fluxes
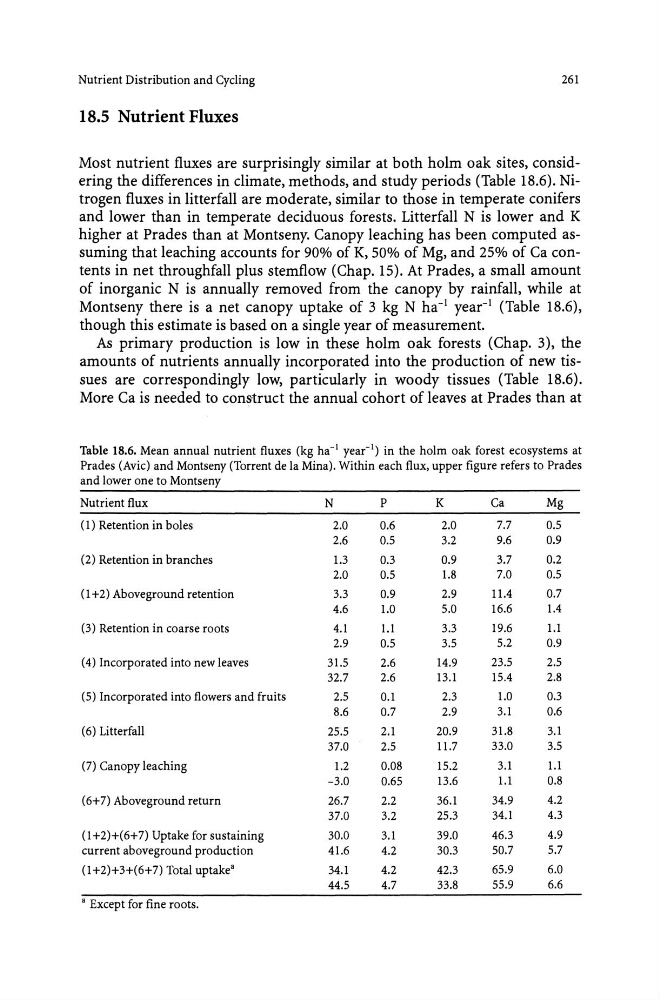
Most nutrient fluxes are surprisingly similar at both holm oak sites, considering the differences in climate, methods, and study periods (Table 18.6). Nitrogen fluxes in litterfall are moderate, similar to those in temperate conifers
and lower than in temperate deciduous forests. Litterfall N is lower and K
higher at Prades than at Montseny. Canopy leaching has been computed assuming that leaching accounts for 90% of K, 50% of Mg, and 25% of Ca contents in net throughfall plus stemflow (Chap. 15). At Prades, a small amount
of inorganic N is annually removed from the canopy by rainfall, while at
Montseny there is a net canopy uptake of 3 kg N ha- I year-I (Table 18.6),
though this estimate is based on a single year of measurement.
As primary production is low in these holm oak forests (Chap. 3), the
amounts of nutrients annually incorporated into the production of new tissues are correspondingly low, particularly in woody tissues (Table 18.6).
More Ca is needed to construct the annual cohort of leaves at Prades than at
Table 18.6. Mean annual nutrient fluxes (kg ha- I year-I) in the holm oak forest ecosystems at
Prades (Avic) and Montseny (Torrent de la Mina). Within each flux, upper figure refers to Prades
and lower one to Montseny
Nutrient flux
N
P
K
Ca
Mg
(1) Retention in boles
2.0
0.6
2.0
7.7
0.5
2.6
0.5
3.2
9.6
0.9
(2) Retention in branches
1.3
0.3
0.9
3.7
0.2
2.0
0.5
1.8
7.0
0.5
(1 +2) Aboveground retention
3.3
0.9
2.9
11.4
0.7
4.6
1.0
5.0
16.6
1.4
(3) Retention in coarse roots
4.1
1.1
3.3
19.6
1.1
2.9
0.5
3.5
5.2
0.9
(4) Incorporated into new leaves
31.5
2.6
14.9
23.5
2.5
32.7
2.6
13.1
15.4
2.8
(5) Incorporated into flowers and fruits
2.5
0.1
2.3
1.0
0.3
8.6
0.7
2.9
3.1
0.6
(6) Li tterfall
25.5
2.1
20.9
31.8
3.1
37.0
2.5
11.7
33.0
3.5
(7) Canopy leaching
1.2
0.08
15.2
3.1
1.1
-3.0
0.65
13.6
1.1
0.8
(6+7) Aboveground return
26.7
2.2
36.1
34.9
4.2
37.0
3.2
25.3
34.1
4.3
(1+2)+(6+7) Uptake for sustaining
30.0
3.1
39.0
46.3
4.9
current aboveground production
41.6
4.2
30.3
50.7
5.7
(1 +2)+3+(6+7) Total uptake'
34.1
4.2
42.3
65.9
6.0
44.5
4.7
33.8
55.9
6.6
a Except for fine roots.
261
18.5 Nutrient Fluxes
Most nutrient fluxes are surprisingly similar at both holm oak sites, considering the differences in climate, methods, and study periods (Table 18.6). Nitrogen fluxes in litterfall are moderate, similar to those in temperate conifers
and lower than in temperate deciduous forests. Litterfall N is lower and K
higher at Prades than at Montseny. Canopy leaching has been computed assuming that leaching accounts for 90% of K, 50% of Mg, and 25% of Ca contents in net throughfall plus stemflow (Chap. 15). At Prades, a small amount
of inorganic N is annually removed from the canopy by rainfall, while at
Montseny there is a net canopy uptake of 3 kg N ha- I year-I (Table 18.6),
though this estimate is based on a single year of measurement.
As primary production is low in these holm oak forests (Chap. 3), the
amounts of nutrients annually incorporated into the production of new tissues are correspondingly low, particularly in woody tissues (Table 18.6).
More Ca is needed to construct the annual cohort of leaves at Prades than at
Table 18.6. Mean annual nutrient fluxes (kg ha- I year-I) in the holm oak forest ecosystems at
Prades (Avic) and Montseny (Torrent de la Mina). Within each flux, upper figure refers to Prades
and lower one to Montseny
Nutrient flux
N
P
K
Ca
Mg
(1) Retention in boles
2.0
0.6
2.0
7.7
0.5
2.6
0.5
3.2
9.6
0.9
(2) Retention in branches
1.3
0.3
0.9
3.7
0.2
2.0
0.5
1.8
7.0
0.5
(1 +2) Aboveground retention
3.3
0.9
2.9
11.4
0.7
4.6
1.0
5.0
16.6
1.4
(3) Retention in coarse roots
4.1
1.1
3.3
19.6
1.1
2.9
0.5
3.5
5.2
0.9
(4) Incorporated into new leaves
31.5
2.6
14.9
23.5
2.5
32.7
2.6
13.1
15.4
2.8
(5) Incorporated into flowers and fruits
2.5
0.1
2.3
1.0
0.3
8.6
0.7
2.9
3.1
0.6
(6) Li tterfall
25.5
2.1
20.9
31.8
3.1
37.0
2.5
11.7
33.0
3.5
(7) Canopy leaching
1.2
0.08
15.2
3.1
1.1
-3.0
0.65
13.6
1.1
0.8
(6+7) Aboveground return
26.7
2.2
36.1
34.9
4.2
37.0
3.2
25.3
34.1
4.3
(1+2)+(6+7) Uptake for sustaining
30.0
3.1
39.0
46.3
4.9
current aboveground production
41.6
4.2
30.3
50.7
5.7
(1 +2)+3+(6+7) Total uptake'
34.1
4.2
42.3
65.9
6.0
44.5
4.7
33.8
55.9
6.6
a Except for fine roots.