

Nutrient Distribution and Cycling
259
After the extreme drought period in the summer of 1994, withered holm
oak crowns were abundant in Prades due to cavitation, and this blocked the
normal process of leaf abscission. As a consequence, dead leaves remained on
the crowns for more than 2 years. Interestingly, their Nand P concentrations
were similar to those in living leaves, demonstrating the importance of retranslocation in reducing Nand P levels in naturally senesced leaves. On the
other hand, K concentrations in the dead, standing leaves were, as expected,
lower than in living leaves due to leaching by rain.
18.3.4 Comparison with Other Forest Ecosystems
Whole-tree nutrient concentrations can be used as indicators of patterns of
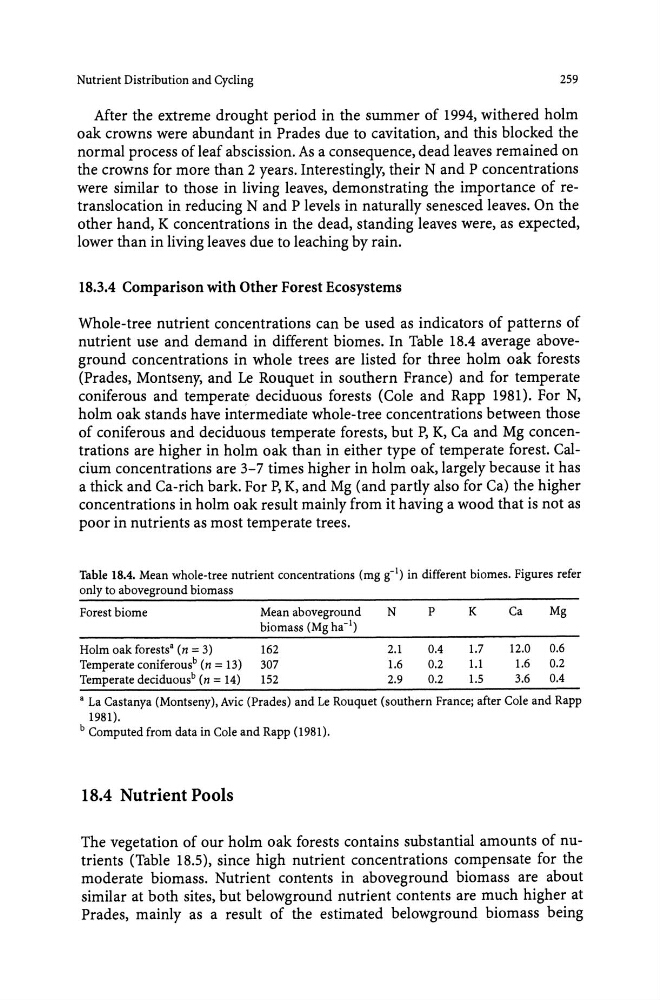
nutrient use and demand in different biomes. In Table 18.4 average aboveground concentrations in whole trees are listed for three holm oak forests
(Prades, Montseny, and Le Rouquet in southern France) and for temperate
coniferous and temperate deciduous forests (Cole and Rapp 1981). For N,
holm oak stands have intermediate whole-tree concentrations between those
of coniferous and deciduous temperate forests, but P, K, Ca and Mg concentrations are higher in holm oak than in either type of temperate forest. Calcium concentrations are 3-7 times higher in holm oak, largely because it has
a thick and Ca-rich bark. For P, K, and Mg (and partly also for Ca) the higher
concentrations in holm oak result mainly from it having a wood that is not as
poor in nutrients as most temperate trees.
Table 18.4. Mean whole-tree nutrient concentrations (mg g-l) in different biomes. Figures refer
only to aboveground biomass
Forest biome
Mean aboveground
N
P
K
Ca
Mg
biomass (Mg ha- 1 )
Holm oak forests· (n = 3)
162
2.1
0.4
1.7
12.0
0.6
Temperate coniferous b (n = l3) 307
1.6
0.2
1.1
1.6
0.2
Temperate deciduous b (n = 14) 152
2.9
0.2
1.5
3.6
0.4
• La Castanya (Montseny), Avic (Prades) and Le Rouquet (southern France; after Cole and Rapp
1981).
b Computed from data in Cole and Rapp (1981).
18.4 Nutrient Pools
The vegetation of our holm oak forests contains substantial amounts of nutrients (Table 18.S), since high nutrient concentrations compensate for the
moderate biomass. Nutrient contents in aboveground biomass are about
similar at both sites, but belowground nutrient contents are much higher at
Prades, mainly as a result of the estimated belowground biomass being
259
After the extreme drought period in the summer of 1994, withered holm
oak crowns were abundant in Prades due to cavitation, and this blocked the
normal process of leaf abscission. As a consequence, dead leaves remained on
the crowns for more than 2 years. Interestingly, their Nand P concentrations
were similar to those in living leaves, demonstrating the importance of retranslocation in reducing Nand P levels in naturally senesced leaves. On the
other hand, K concentrations in the dead, standing leaves were, as expected,
lower than in living leaves due to leaching by rain.
18.3.4 Comparison with Other Forest Ecosystems
Whole-tree nutrient concentrations can be used as indicators of patterns of
nutrient use and demand in different biomes. In Table 18.4 average aboveground concentrations in whole trees are listed for three holm oak forests
(Prades, Montseny, and Le Rouquet in southern France) and for temperate
coniferous and temperate deciduous forests (Cole and Rapp 1981). For N,
holm oak stands have intermediate whole-tree concentrations between those
of coniferous and deciduous temperate forests, but P, K, Ca and Mg concentrations are higher in holm oak than in either type of temperate forest. Calcium concentrations are 3-7 times higher in holm oak, largely because it has
a thick and Ca-rich bark. For P, K, and Mg (and partly also for Ca) the higher
concentrations in holm oak result mainly from it having a wood that is not as
poor in nutrients as most temperate trees.
Table 18.4. Mean whole-tree nutrient concentrations (mg g-l) in different biomes. Figures refer
only to aboveground biomass
Forest biome
Mean aboveground
N
P
K
Ca
Mg
biomass (Mg ha- 1 )
Holm oak forests· (n = 3)
162
2.1
0.4
1.7
12.0
0.6
Temperate coniferous b (n = l3) 307
1.6
0.2
1.1
1.6
0.2
Temperate deciduous b (n = 14) 152
2.9
0.2
1.5
3.6
0.4
• La Castanya (Montseny), Avic (Prades) and Le Rouquet (southern France; after Cole and Rapp
1981).
b Computed from data in Cole and Rapp (1981).
18.4 Nutrient Pools
The vegetation of our holm oak forests contains substantial amounts of nutrients (Table 18.S), since high nutrient concentrations compensate for the
moderate biomass. Nutrient contents in aboveground biomass are about
similar at both sites, but belowground nutrient contents are much higher at
Prades, mainly as a result of the estimated belowground biomass being