

256
Antoni Escarre, Ferran Rodil, Jaume Terradas and Xavier Mayor
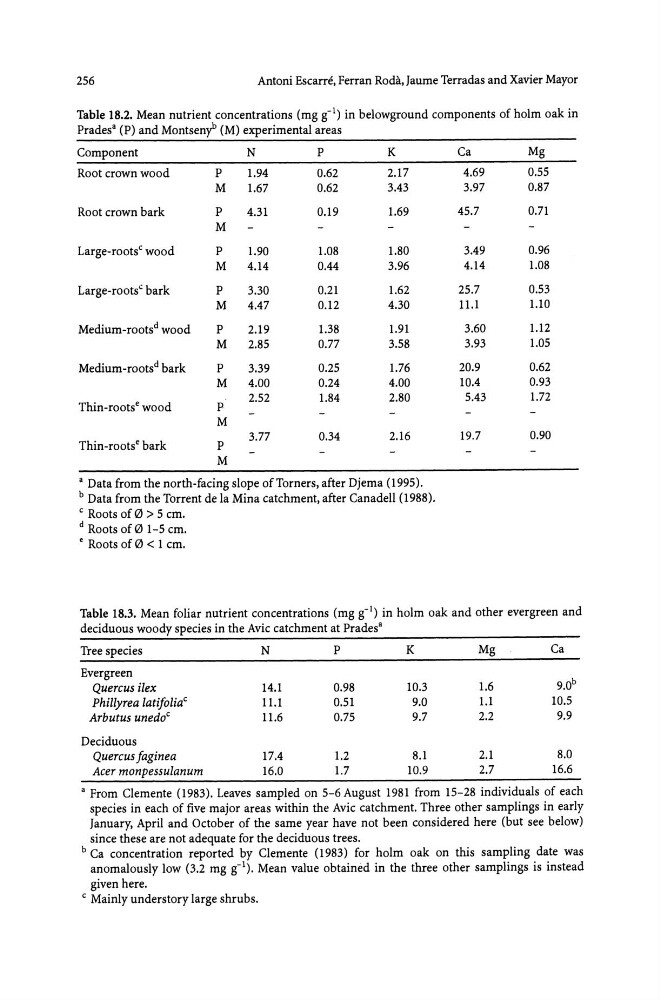
Table 1S.2. Mean nutrient concentrations (mg g-l) in belowground components of holm oak in
Prades· (P) and Montsenf (M) experimental areas
Component
N
P
K
Ca
Mg
Root crown wood
P
1.94
0.62
2.17
4.69
0.55
M
1.67
0.62
3.43
3.97
0.87
Root crown bark
P
4.31
0.19
1.69
45.7
0.71
M
Large-roots C wood
P
1.90
1.08
1.80
3.49
0.96
M
4.14
0.44
3.96
4.14
1.08
Large-roots C bark
P
3.30
0.21
1.62
25.7
0.53
M
4.47
0.12
4.30
11.1
1.10
Medium-roots d wood
P
2.19
1.38
1.91
3.60
1.12
M
2.85
0.77
3.5S
3.93
1.05
Medium-roots d bark
P
3.39
0.25
1.76
20.9
0.62
M
4.00
0.24
4.00
10.4
0.93
Thin-roots e wood
P
2.52
1.84
2.80
5.43
1.72
M
Thin-roots e bark
P
3.77
0.34
2.16
19.7
0.90
M
a Data from the north-facing slope of Torners, after Djema (1995).
b Data from the Torrent de la Mina catchment, after Canadell (1988).
C Roots of 0 > 5 cm.
d Roots of 01-5 cm.
e Roots of 0 < 1 cm.
Table 1S.3. Mean foliar nutrient concentrations (mg g-l) in holm oak and other evergreen and
deciduous woody species in the Avic catchment at Prades·
Tree species
N
P
K
Mg
Ca
Evergreen
9.0 b
Quercus Hex
14.1
0.98
10.3
1.6
Phillyrea latifolia C
ILl
0.51
9.0
1.1
10.5
Arbutus unedo c
11.6
0.75
9.7
2.2
9.9
Deciduous
Quercusfaginea
17.4
1.2
8.1
2.1
8.0
Acer monpessulanum
16.0
1.7
10.9
2.7
16.6
a From Clemente (1983). Leaves sampled on 5-6 August 1981 from 15-28 individuals of each
species in each of five major areas within the Avic catchment. Three other samplings in early
January, April and October of the same year have not been considered here (but see below)
since these are not adequate for the deciduous trees.
b Ca concentration reported by Clemente (1983) for holm oak on this sampling date was
anomalously low (3.2 mg g-l). Mean value obtained in the three other samplings is instead
given here.
C Mainly understory large shrubs.
Antoni Escarre, Ferran Rodil, Jaume Terradas and Xavier Mayor
Table 1S.2. Mean nutrient concentrations (mg g-l) in belowground components of holm oak in
Prades· (P) and Montsenf (M) experimental areas
Component
N
P
K
Ca
Mg
Root crown wood
P
1.94
0.62
2.17
4.69
0.55
M
1.67
0.62
3.43
3.97
0.87
Root crown bark
P
4.31
0.19
1.69
45.7
0.71
M
Large-roots C wood
P
1.90
1.08
1.80
3.49
0.96
M
4.14
0.44
3.96
4.14
1.08
Large-roots C bark
P
3.30
0.21
1.62
25.7
0.53
M
4.47
0.12
4.30
11.1
1.10
Medium-roots d wood
P
2.19
1.38
1.91
3.60
1.12
M
2.85
0.77
3.5S
3.93
1.05
Medium-roots d bark
P
3.39
0.25
1.76
20.9
0.62
M
4.00
0.24
4.00
10.4
0.93
Thin-roots e wood
P
2.52
1.84
2.80
5.43
1.72
M
Thin-roots e bark
P
3.77
0.34
2.16
19.7
0.90
M
a Data from the north-facing slope of Torners, after Djema (1995).
b Data from the Torrent de la Mina catchment, after Canadell (1988).
C Roots of 0 > 5 cm.
d Roots of 01-5 cm.
e Roots of 0 < 1 cm.
Table 1S.3. Mean foliar nutrient concentrations (mg g-l) in holm oak and other evergreen and
deciduous woody species in the Avic catchment at Prades·
Tree species
N
P
K
Mg
Ca
Evergreen
9.0 b
Quercus Hex
14.1
0.98
10.3
1.6
Phillyrea latifolia C
ILl
0.51
9.0
1.1
10.5
Arbutus unedo c
11.6
0.75
9.7
2.2
9.9
Deciduous
Quercusfaginea
17.4
1.2
8.1
2.1
8.0
Acer monpessulanum
16.0
1.7
10.9
2.7
16.6
a From Clemente (1983). Leaves sampled on 5-6 August 1981 from 15-28 individuals of each
species in each of five major areas within the Avic catchment. Three other samplings in early
January, April and October of the same year have not been considered here (but see below)
since these are not adequate for the deciduous trees.
b Ca concentration reported by Clemente (1983) for holm oak on this sampling date was
anomalously low (3.2 mg g-l). Mean value obtained in the three other samplings is instead
given here.
C Mainly understory large shrubs.