

214
o
o
Juan Bellot, Anna Avila and Anselm Rodrigo
38 m
N
I\.)
(]'I
3
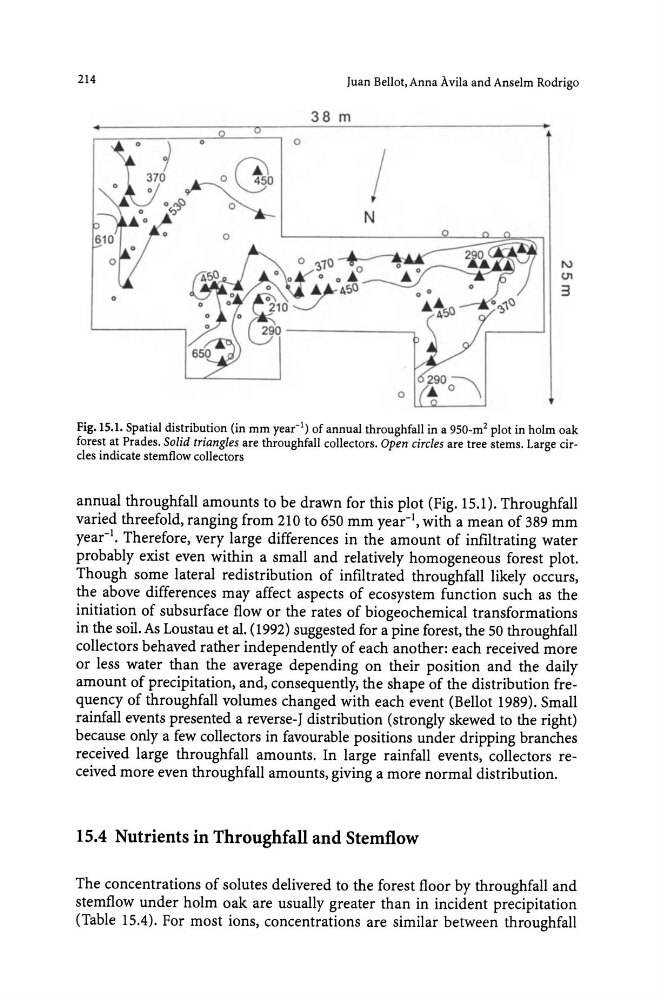
Fig.I5.I. Spatial distribution (in mm year-I) of annual throughfall in a 950-m 2 plot in holm oak
forest at Prades. Solid triangles are throughfall collectors. Open circles are tree stems. Large circles indicate stemflow collectors
annual throughfall amounts to be drawn for this plot (Fig. 15.1). Throughfall
varied threefold, ranging from 210 to 650 mm year-I, with a mean of 389 mm
year-I. Therefore, very large differences in the amount of infiltrating water
probably exist even within a small and relatively homogeneous forest plot.
Though some lateral redistribution of infiltrated throughfall likely occurs,
the above differences may affect aspects of ecosystem function such as the
initiation of subsurface flow or the rates of biogeochemical transformations
in the soil. As Loustau et al. (1992) suggested for a pine forest, the 50 throughfall
collectors behaved rather independently of each another: each received more
or less water than the average depending on their position and the daily
amount of precipitation, and, consequently, the shape of the distribution frequency of throughfall volumes changed with each event (Bellot 1989). Small
rainfall events presented a reverse-J distribution (strongly skewed to the right)
because only a few collectors in favourable positions under dripping branches
received large throughfall amounts. In large rainfall events, collectors received more even throughfall amounts, giving a more normal distribution.
15.4 Nutrients in Throughfall and Stemflow
The concentrations of solutes delivered to the forest floor by throughfall and
stemflow under holm oak are usually greater than in incident precipitation
(Table 15.4). For most ions, concentrations are similar between throughfall
o
o
Juan Bellot, Anna Avila and Anselm Rodrigo
38 m
N
I\.)
(]'I
3
Fig.I5.I. Spatial distribution (in mm year-I) of annual throughfall in a 950-m 2 plot in holm oak
forest at Prades. Solid triangles are throughfall collectors. Open circles are tree stems. Large circles indicate stemflow collectors
annual throughfall amounts to be drawn for this plot (Fig. 15.1). Throughfall
varied threefold, ranging from 210 to 650 mm year-I, with a mean of 389 mm
year-I. Therefore, very large differences in the amount of infiltrating water
probably exist even within a small and relatively homogeneous forest plot.
Though some lateral redistribution of infiltrated throughfall likely occurs,
the above differences may affect aspects of ecosystem function such as the
initiation of subsurface flow or the rates of biogeochemical transformations
in the soil. As Loustau et al. (1992) suggested for a pine forest, the 50 throughfall
collectors behaved rather independently of each another: each received more
or less water than the average depending on their position and the daily
amount of precipitation, and, consequently, the shape of the distribution frequency of throughfall volumes changed with each event (Bellot 1989). Small
rainfall events presented a reverse-J distribution (strongly skewed to the right)
because only a few collectors in favourable positions under dripping branches
received large throughfall amounts. In large rainfall events, collectors received more even throughfall amounts, giving a more normal distribution.
15.4 Nutrients in Throughfall and Stemflow
The concentrations of solutes delivered to the forest floor by throughfall and
stemflow under holm oak are usually greater than in incident precipitation
(Table 15.4). For most ions, concentrations are similar between throughfall