

Throughfall and 5temflow
213
at Prades than at Montseny. These patterns, together with the threshold upon
which both flows start (see below) reflect that the canopy and trunk waterstorage capacity is higher at Montseny, and, consequently, more water can be
evaporated from the wet canopy. The observed stemflow percentages at
Prades are similar to those reported for shrub communities, which usually
produce substantial stemflow (Navar and Bryan 1990; Puigdefabregas et al.
1996; Gonzalez and Bellot 1997). On the other hand, Montseny resembles the
holm oak forest at Le Rouquet (southern France; Rapp and Romane 1968) in
producing little stemflow.
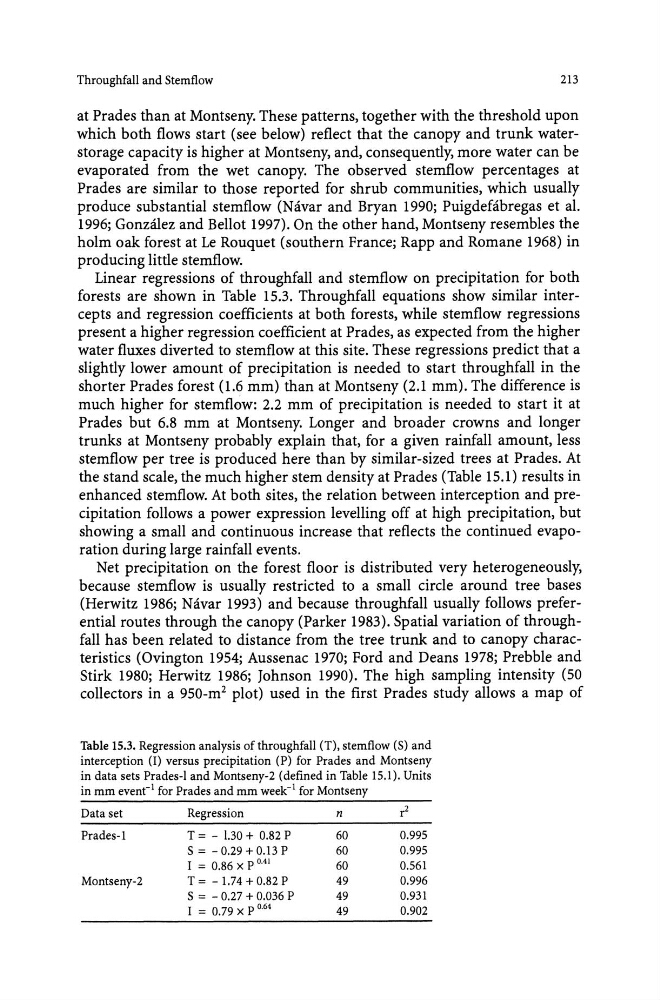
Linear regressions of throughfall and stemflow on precipitation for both
forests are shown in Table 15.3. Throughfall equations show similar intercepts and regression coefficients at both forests, while stemflow regressions
present a higher regression coefficient at Prades, as expected from the higher
water fluxes diverted to stemflow at this site. These regressions predict that a
slightly lower amount of precipitation is needed to start throughfall in the
shorter Prades forest (1.6 mm) than at Montseny (2.1 mm). The difference is
much higher for stemflow: 2.2 mm of precipitation is needed to start it at
Prades but 6.8 mm at Montseny. Longer and broader crowns and longer
trunks at Montseny probably explain that, for a given rainfall amount, less
stemflow per tree is produced here than by similar-sized trees at Prades. At
the stand scale, the much higher stem density at Prades (Table 15.1) results in
enhanced stemflow. At both sites, the relation between interception and precipitation follows a power expression levelling off at high precipitation, but
showing a small and continuous increase that reflects the continued evaporation during large rainfall events.
Net precipitation on the forest floor is distributed very heterogeneously,
because stemflow is usually restricted to a small circle around tree bases
(Herwitz 1986; Navar 1993) and because throughfall usually follows preferential routes through the canopy (Parker 1983). Spatial variation of throughfall has been related to distance from the tree trunk and to canopy characteristics (Ovington 1954; Aussenac 1970; Ford and Deans 1978; Prebble and
Stirk 1980; Herwitz 1986; Johnson 1990). The high sampling intensity (50
collectors in a 950-m 2 plot) used in the first Prades study allows a map of
Table 15.3. Regression analysis of throughfall (T), stem flow (5) and
interception (I) versus precipitation (P) for Prades and Montseny
in data sets Prades-l and Montseny-2 (defined in Table 15.1). Units
in mm evenC l for Prades and mm week- 1 for Montseny
Data set
Regression
n
~
Prades-l
T = - 1.30 + 0.82 P
60
0.995
5 = - 0.29 + 0.l3 P
60
0.995
I = 0.86 x P 0.41
60
0.561
Montseny-2
T = - 1.74 + 0.82 P
49
0.996
5 = - 0.27 + 0.036 P
49
0.931
I = 0.79 x P 0.64
49
0.902
213
at Prades than at Montseny. These patterns, together with the threshold upon
which both flows start (see below) reflect that the canopy and trunk waterstorage capacity is higher at Montseny, and, consequently, more water can be
evaporated from the wet canopy. The observed stemflow percentages at
Prades are similar to those reported for shrub communities, which usually
produce substantial stemflow (Navar and Bryan 1990; Puigdefabregas et al.
1996; Gonzalez and Bellot 1997). On the other hand, Montseny resembles the
holm oak forest at Le Rouquet (southern France; Rapp and Romane 1968) in
producing little stemflow.
Linear regressions of throughfall and stemflow on precipitation for both
forests are shown in Table 15.3. Throughfall equations show similar intercepts and regression coefficients at both forests, while stemflow regressions
present a higher regression coefficient at Prades, as expected from the higher
water fluxes diverted to stemflow at this site. These regressions predict that a
slightly lower amount of precipitation is needed to start throughfall in the
shorter Prades forest (1.6 mm) than at Montseny (2.1 mm). The difference is
much higher for stemflow: 2.2 mm of precipitation is needed to start it at
Prades but 6.8 mm at Montseny. Longer and broader crowns and longer
trunks at Montseny probably explain that, for a given rainfall amount, less
stemflow per tree is produced here than by similar-sized trees at Prades. At
the stand scale, the much higher stem density at Prades (Table 15.1) results in
enhanced stemflow. At both sites, the relation between interception and precipitation follows a power expression levelling off at high precipitation, but
showing a small and continuous increase that reflects the continued evaporation during large rainfall events.
Net precipitation on the forest floor is distributed very heterogeneously,
because stemflow is usually restricted to a small circle around tree bases
(Herwitz 1986; Navar 1993) and because throughfall usually follows preferential routes through the canopy (Parker 1983). Spatial variation of throughfall has been related to distance from the tree trunk and to canopy characteristics (Ovington 1954; Aussenac 1970; Ford and Deans 1978; Prebble and
Stirk 1980; Herwitz 1986; Johnson 1990). The high sampling intensity (50
collectors in a 950-m 2 plot) used in the first Prades study allows a map of
Table 15.3. Regression analysis of throughfall (T), stem flow (5) and
interception (I) versus precipitation (P) for Prades and Montseny
in data sets Prades-l and Montseny-2 (defined in Table 15.1). Units
in mm evenC l for Prades and mm week- 1 for Montseny
Data set
Regression
n
~
Prades-l
T = - 1.30 + 0.82 P
60
0.995
5 = - 0.29 + 0.l3 P
60
0.995
I = 0.86 x P 0.41
60
0.561
Montseny-2
T = - 1.74 + 0.82 P
49
0.996
5 = - 0.27 + 0.036 P
49
0.931
I = 0.79 x P 0.64
49
0.902