

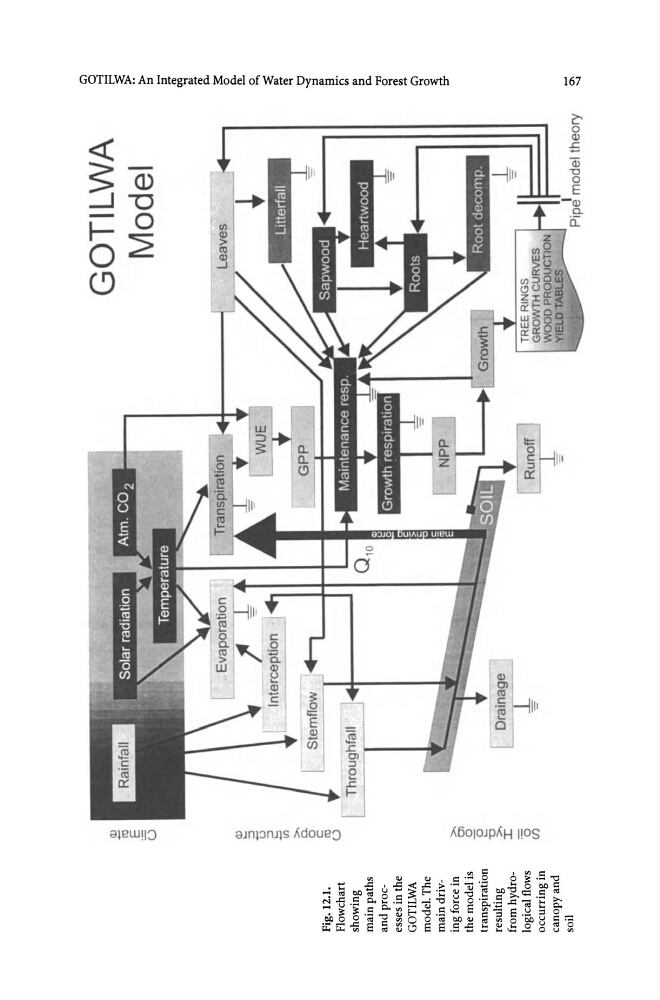
Fig. 12.1.
Flowchart
showing
main paths
and processes in the
GOTILWA
model. The
maindriving force in
the model is
transpiration
resulting
from hydrological
flows
occurring in
canopy and
soil
Q)
iii
. ~
G
~
:::J
t5
2
in
0o
c
ro
U
>Ol
o
e
-0
>I
'0
C/)
Stemflow
0 10
GOTILWA
Model
TREE RINGS
GROWTH CURVES
WOOD PRODUCTION
YIELD
model theory
Cl
~
~
?:'
>
::s
!
*
Po
g:
Po
!!.
g,
@
'" ....
t::l
~
'"
2.
Q
§
Po
~
nl
~
Cl
!
- 0.....
Flowchart
showing
main paths
and processes in the
GOTILWA
model. The
maindriving force in
the model is
transpiration
resulting
from hydrological
flows
occurring in
canopy and
soil
Q)
iii
. ~
G
~
:::J
t5
2
in
0o
c
ro
U
>Ol
o
e
-0
>I
'0
C/)
Stemflow
0 10
GOTILWA
Model
TREE RINGS
GROWTH CURVES
WOOD PRODUCTION
YIELD
model theory
Cl
~
~
?:'
>
::s
!
*
Po
g:
Po
!!.
g,
@
'" ....
t::l
~
'"
2.
Q
§
Po
~
nl
~
Cl
!
- 0.....