

158
~
600 , - - - - - - - - - - - ,
~Clustered
- + - Non- Clustered
.... 500
>E
E
UJ 400
'7
... >C)I
E
0)
~
'0)
~
0)
W
::::>
~
300 +-.,.........,,.--..--,---.--.---.--,........,~-I
6
5
4
14
13
12
11
10
1
2
3
4
5
2 -2
LAl,m m
6
7
AnnaSaIa
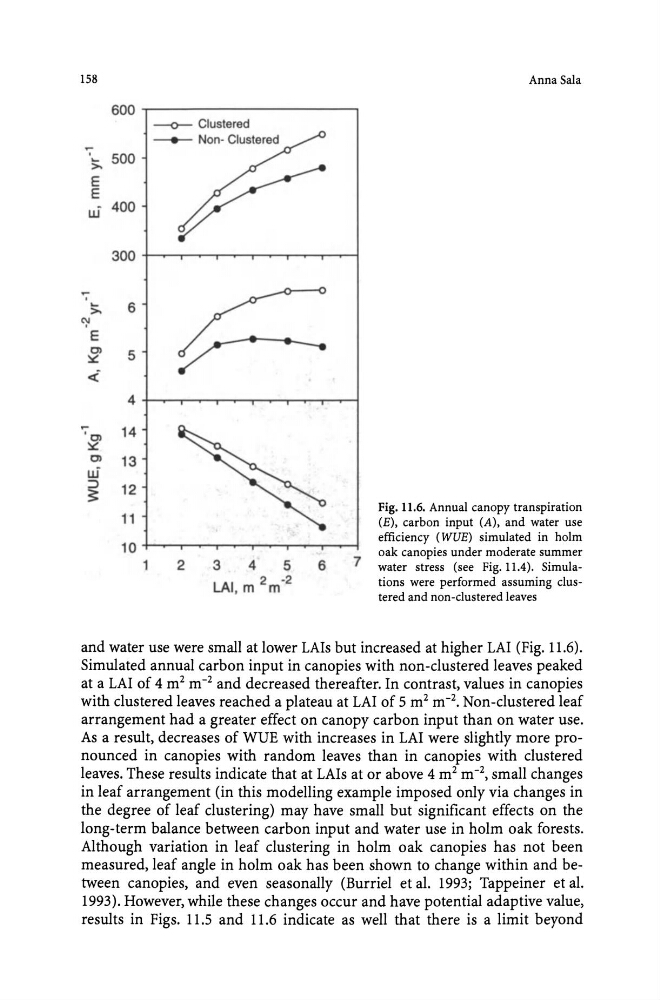
Fig. 11.6. Annual canopy transpiration
(E). carbon input (A). and water use
efficiency (WUE) simulated in holm
oak canopies under moderate summer
water stress (see Fig. 11.4). Simulations were performed assuming clustered and non-clustered leaves
and water use were small at lower LAls but increased at higher LAI (Fig. 11.6).
Simulated annual carbon input in canopies with non-clustered leaves peaked
at a LAI of 4 m 2 m- 2 and decreased thereafter. In contrast, values in canopies
with clustered leaves reached a plateau at LAI of 5 m 2 m- 2 • Non-clustered leaf
arrangement had a greater effect on canopy carbon input than on water use.
As a result, decreases of WUE with increases in LAI were slightly more pronounced in canopies with random leaves than in canopies with clustered
leaves. These results indicate that at LAls at or above 4 m 2 m- 2 , small changes
in leaf arrangement (in this modelling example imposed only via changes in
the degree of leaf clustering) may have small but significant effects on the
long-term balance between carbon input and water use in holm oak forests.
Although variation in leaf clustering in holm oak canopies has not been
measured, leaf angle in holm oak has been shown to change within and between canopies, and even seasonally (Burriel et al. 1993; Tappeiner et al.
1993). However, while these changes occur and have potential adaptive value,
results in Figs. 11.5 and 11.6 indicate as well that there is a limit beyond
~
600 , - - - - - - - - - - - ,
~Clustered
- + - Non- Clustered
.... 500
>E
E
UJ 400
'7
... >C)I
E
0)
~
'0)
~
0)
W
::::>
~
300 +-.,.........,,.--..--,---.--.---.--,........,~-I
6
5
4
14
13
12
11
10
1
2
3
4
5
2 -2
LAl,m m
6
7
AnnaSaIa
Fig. 11.6. Annual canopy transpiration
(E). carbon input (A). and water use
efficiency (WUE) simulated in holm
oak canopies under moderate summer
water stress (see Fig. 11.4). Simulations were performed assuming clustered and non-clustered leaves
and water use were small at lower LAls but increased at higher LAI (Fig. 11.6).
Simulated annual carbon input in canopies with non-clustered leaves peaked
at a LAI of 4 m 2 m- 2 and decreased thereafter. In contrast, values in canopies
with clustered leaves reached a plateau at LAI of 5 m 2 m- 2 • Non-clustered leaf
arrangement had a greater effect on canopy carbon input than on water use.
As a result, decreases of WUE with increases in LAI were slightly more pronounced in canopies with random leaves than in canopies with clustered
leaves. These results indicate that at LAls at or above 4 m 2 m- 2 , small changes
in leaf arrangement (in this modelling example imposed only via changes in
the degree of leaf clustering) may have small but significant effects on the
long-term balance between carbon input and water use in holm oak forests.
Although variation in leaf clustering in holm oak canopies has not been
measured, leaf angle in holm oak has been shown to change within and between canopies, and even seasonally (Burriel et al. 1993; Tappeiner et al.
1993). However, while these changes occur and have potential adaptive value,
results in Figs. 11.5 and 11.6 indicate as well that there is a limit beyond