

Modelling Canopy Gas Exchange During Summer Drought
155
1000
. R
'.c:
Ov
'E
800
0
E
'"
600
'E
0'" 400
()
en
~- 200
0
. R
Ov
.c:
'E 100
0
E
E
E
w
0
0.5
"": .c:
100
Prec i pitat ion
0.4C
fLl
0
80
E
0.3
E 60
i
E
E
c
0.2 E
0
~
40
cu
CD
" &
...
'0
20
0.1 Q5
!!!
a..
0
0.0
J F MA M J J A S o N 0
Month
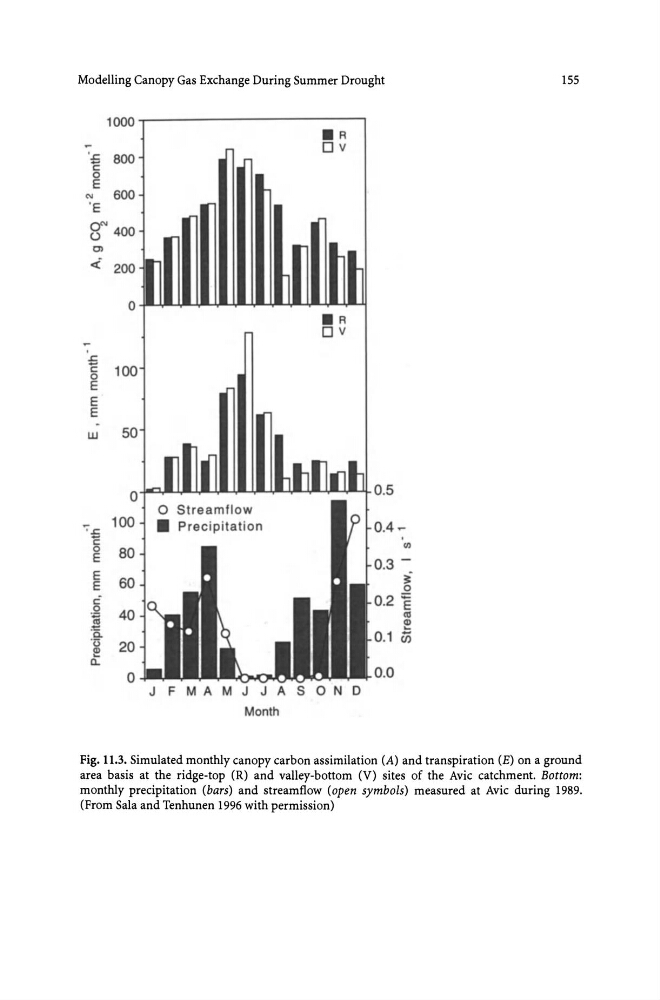
Fig. 11,3. Simulated monthly canopy carbon assimilation (A) and transpiration (E) on a ground
area basis at the ridge-top (R) and valley-bottom (V) sites of the Avic catchment. Bottom:
monthly precipitation (bars) and streamflow (open symbols) measured at Avic during 1989.
(From Sala and Tenhunen 1996 with permission)
155
1000
. R
'.c:
Ov
'E
800
0
E
'"
600
'E
0'" 400
()
en
~- 200
0
. R
Ov
.c:
'E 100
0
E
E
E
w
0
0.5
"": .c:
100
Prec i pitat ion
0.4C
fLl
0
80
E
0.3
E 60
i
E
E
c
0.2 E
0
~
40
cu
CD
" &
...
'0
20
0.1 Q5
!!!
a..
0
0.0
J F MA M J J A S o N 0
Month
Fig. 11,3. Simulated monthly canopy carbon assimilation (A) and transpiration (E) on a ground
area basis at the ridge-top (R) and valley-bottom (V) sites of the Avic catchment. Bottom:
monthly precipitation (bars) and streamflow (open symbols) measured at Avic during 1989.
(From Sala and Tenhunen 1996 with permission)