

Modelling Canopy Gas Exchange During Summer Drought
153
11.3.2 Model Performance
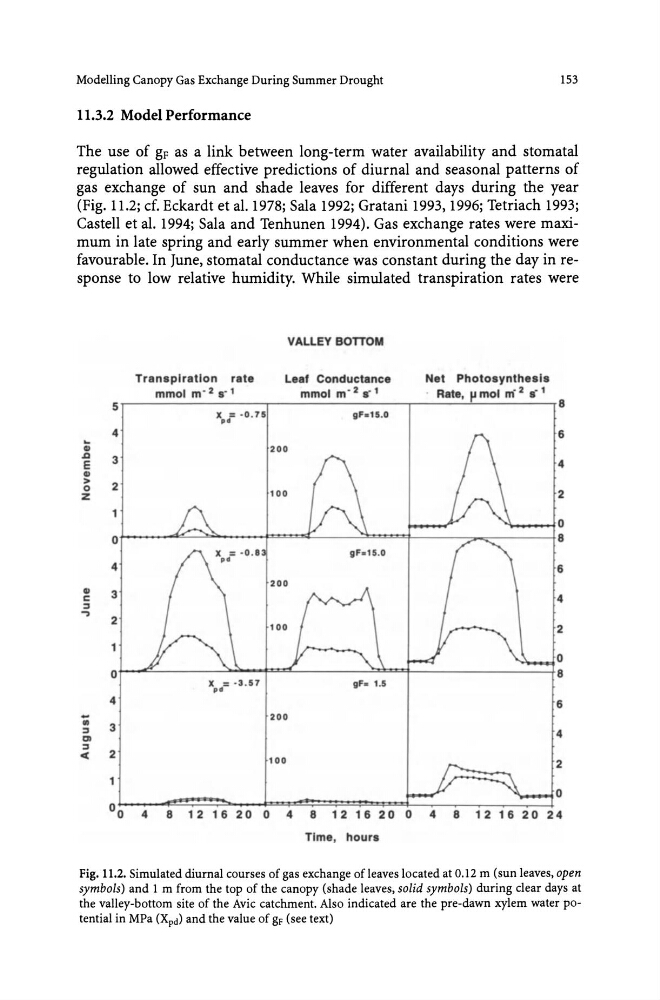
The use of gF as a link between long-term water availability and stomatal
regulation allowed effective predictions of diurnal and seasonal patterns of
gas exchange of sun and shade leaves for different days during the year
(Fig. 11.2; cf. Eckardt et al. 1978; Sala 1992; Gratani 1993, 1996; Tetriach 1993;
Castell et al. 1994; Sala and Tenhunen 1994). Gas exchange rates were maximum in late spring and early summer when environmental conditions were
favourable. In June, stomatal conductance was constant during the day in response to low relative humidity. While simulated transpiration rates were
VALLEY BOTTOM
Transpiration rate
Leaf Conductance
Net Photosynthesis
mmol m - 2 S-1
mmol m - 2 s'l
. Rate, fA mol m' 2 s- 1
5
8
X =-0.75
p.
gF.15.0
4
6
...
CI
200
.a
3
E
4
CI
>
2
0
2
z
0
4
CD
3
c:
::J
.... 2
0
x = -3. 57
p'
gF. 1 .5
4
6
-
200
III
3
::J
4
01
::J
' "
2
100
1
00
4
8 1 2 1 6 2 0 0
4
8 1 2 1 6 2 0
8 121620 24
Time, hours
Fig. 11.2. Simulated diurnal courses of gas exchange of leaves located at 0.12 m (sun leaves, open
symbols) and 1 m from the top of the canopy (shade leaves, solid symbols) during clear days at
the valley-bottom site of the Avic catchment. Also indicated are the pre-dawn xylem water potential in MPa (Xpd) and the value of gF (see text)
153
11.3.2 Model Performance
The use of gF as a link between long-term water availability and stomatal
regulation allowed effective predictions of diurnal and seasonal patterns of
gas exchange of sun and shade leaves for different days during the year
(Fig. 11.2; cf. Eckardt et al. 1978; Sala 1992; Gratani 1993, 1996; Tetriach 1993;
Castell et al. 1994; Sala and Tenhunen 1994). Gas exchange rates were maximum in late spring and early summer when environmental conditions were
favourable. In June, stomatal conductance was constant during the day in response to low relative humidity. While simulated transpiration rates were
VALLEY BOTTOM
Transpiration rate
Leaf Conductance
Net Photosynthesis
mmol m - 2 S-1
mmol m - 2 s'l
. Rate, fA mol m' 2 s- 1
5
8
X =-0.75
p.
gF.15.0
4
6
...
CI
200
.a
3
E
4
CI
>
2
0
2
z
0
4
CD
3
c:
::J
.... 2
0
x = -3. 57
p'
gF. 1 .5
4
6
-
200
III
3
::J
4
01
::J
' "
2
100
1
00
4
8 1 2 1 6 2 0 0
4
8 1 2 1 6 2 0
8 121620 24
Time, hours
Fig. 11.2. Simulated diurnal courses of gas exchange of leaves located at 0.12 m (sun leaves, open
symbols) and 1 m from the top of the canopy (shade leaves, solid symbols) during clear days at
the valley-bottom site of the Avic catchment. Also indicated are the pre-dawn xylem water potential in MPa (Xpd) and the value of gF (see text)