

Nonintrusive Indicator for Rapid Assessment of In Vivo Photosynthesis
Therefore:
Estimated maximal rate = PFO x 0.83 x 0.84 x 0.5
= PFO x 0.35.
65
(11)
The value of 0.35 closely corresponds to experimentally derived values
for the parameter m =
Once it is established that a certain species does not constitute an exception from the general rule, the actually observed relative electron transport
rate, PFO x LlFIFm ', may be compared with the response predicted for a
"model leaf" and conclusions on the apparent limitations can be drawn.
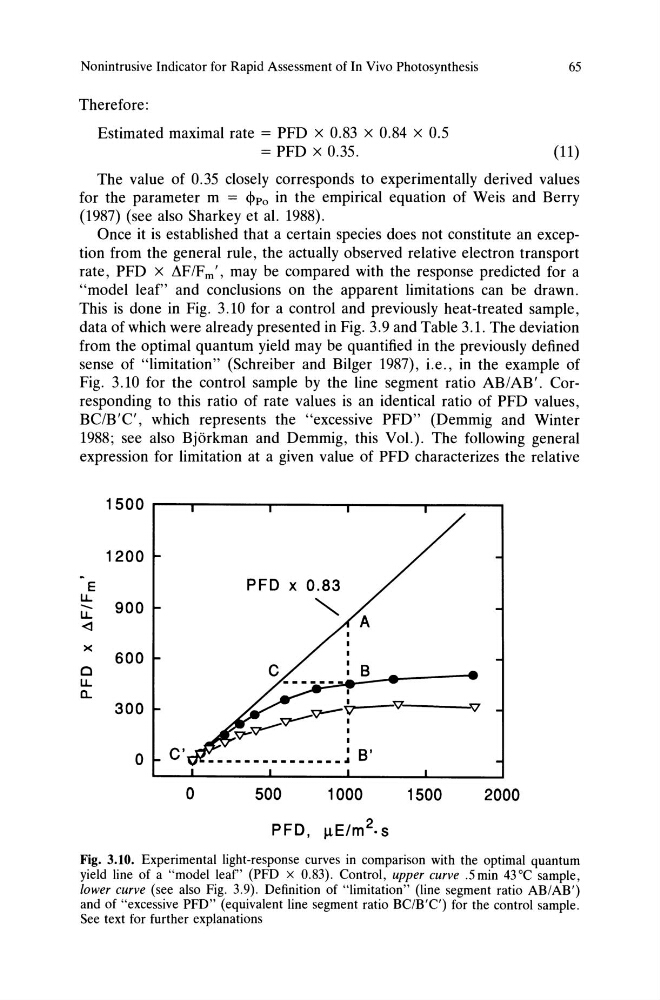
This is done in Fig. 3.10 for a control and previously heat-treated sample,
data of which were already presented in Fig. 3.9 and Table 3.1. The deviation
from the optimal quantum yield may be quantified in the previously defined
sense of "limitation" (Schreiber and Bilger 1987), i.e., in the example of
Fig. 3.10 for the control sample by the line segment ratio AB/AB'. Corresponding to this ratio of rate values is an identical ratio of PFO values,
BC/B'C', which represents the "excessive PFO" (Oemmig and Winter
1988; see also Bjorkman and Oemmig, this Vol.). The following general
expression for limitation at a given value of PFO characterizes the relative
1500
1200
E
L1.
-- 900
L1.
600
0
L1.
a..
300
- - - - " ' \ I
0
C'
0
500
1000
1500
2000
PFD, JlE/m2. s
Fig. 3.10. Experimental light-response curves in comparison with the optimal quantum
yield line of a "model leaf' (PFD x 0.83). Control, upper curve .5 min 43 DC sample,
lower curve (see also Fig. 3.9). Definition of "limitation" (line segment ratio AB/AB')
and of "excessive PFD" (equivalent line segment ratio BC/B'C') for the control sample.
See text for further explanations
Therefore:
Estimated maximal rate = PFO x 0.83 x 0.84 x 0.5
= PFO x 0.35.
65
(11)
The value of 0.35 closely corresponds to experimentally derived values
for the parameter m =
Once it is established that a certain species does not constitute an exception from the general rule, the actually observed relative electron transport
rate, PFO x LlFIFm ', may be compared with the response predicted for a
"model leaf" and conclusions on the apparent limitations can be drawn.
This is done in Fig. 3.10 for a control and previously heat-treated sample,
data of which were already presented in Fig. 3.9 and Table 3.1. The deviation
from the optimal quantum yield may be quantified in the previously defined
sense of "limitation" (Schreiber and Bilger 1987), i.e., in the example of
Fig. 3.10 for the control sample by the line segment ratio AB/AB'. Corresponding to this ratio of rate values is an identical ratio of PFO values,
BC/B'C', which represents the "excessive PFO" (Oemmig and Winter
1988; see also Bjorkman and Oemmig, this Vol.). The following general
expression for limitation at a given value of PFO characterizes the relative
1500
1200
E
L1.
-- 900
L1.
600
0
L1.
a..
300
- - - - " ' \ I
0
C'
0
500
1000
1500
2000
PFD, JlE/m2. s
Fig. 3.10. Experimental light-response curves in comparison with the optimal quantum
yield line of a "model leaf' (PFD x 0.83). Control, upper curve .5 min 43 DC sample,
lower curve (see also Fig. 3.9). Definition of "limitation" (line segment ratio AB/AB')
and of "excessive PFD" (equivalent line segment ratio BC/B'C') for the control sample.
See text for further explanations