

C/)
5
-
./" +DCMU
c
:::J
Fm
Cll
4
-~"~
.
•
Control
"0
Cll
3
:1
>Cll
~I
0
c
2
~~
1 sec
Cll
.~
0
:,~
C/)
Cll
.... 1
F
--------------------0
:::J
o if AL on
u.
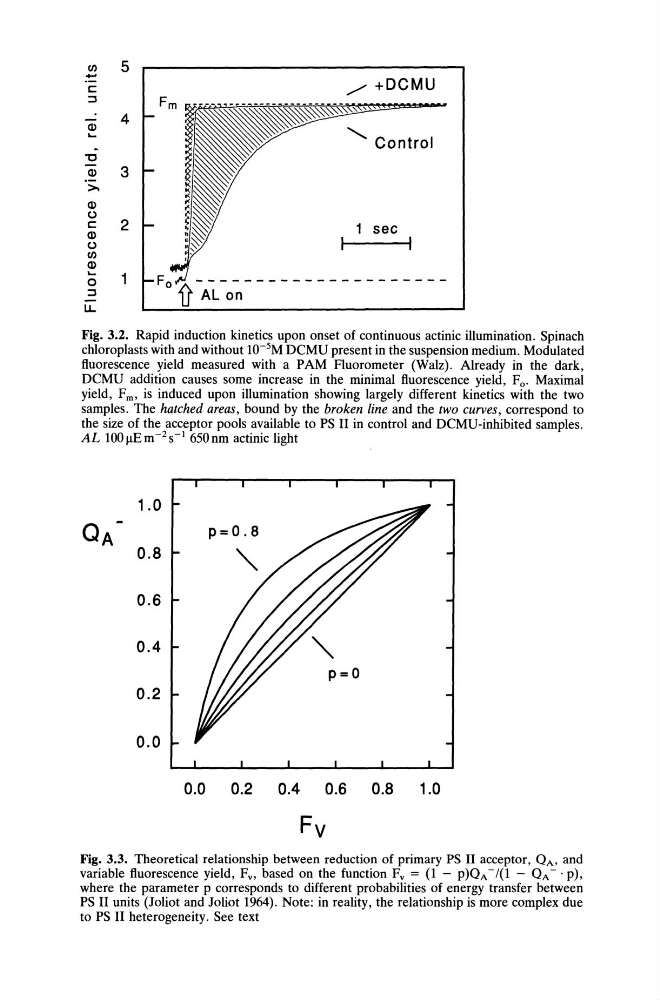
Fig. 3.2. Rapid induction kinetics upon onset of continuous actinic illumination. Spinach
chloroplasts with and without 1O- 5 M DCMU present in the suspension medium. Modulated
fluorescence yield measured with a PAM Fluorometer (Walz). Already in the dark,
DCMU addition causes some increase in the minimal fluorescence yield, F o. Maximal
yield, Fm, is induced upon illumination showing largely different kinetics with the two
samples. The hatched areas, bound by the broken line and the two curves, correspond to
the size of the acceptor pools available to PS II in control and DCMU-inhibited samples.
AL lOOIlEm-2s-1 650nm actinic light
1.0
QA
p=0.8
0.8
0.6
0.4
p=O
0.2
0.0
0.0 0.2 0.4 0.6 0.8
1.0
Fv
Fig. 3.3. Theoretical relationship between reduction of primary PS II acceptor, QA, and
variable fluorescence yield, Fv, based on the function Fv = (1 - p)QA -/(1 - QA - . p),
where the parameter p corresponds to different probabilities of energy transfer between
PS II units (Joliot and Joliot 1964). Note: in reality, the relationship is more complex due
to PS II heterogeneity. See text
5
-
./" +DCMU
c
:::J
Fm
Cll
4
-~"~
.
•
Control
"0
Cll
3
:1
>Cll
~I
0
c
2
~~
1 sec
Cll
.~
0
:,~
C/)
Cll
.... 1
F
--------------------0
:::J
o if AL on
u.
Fig. 3.2. Rapid induction kinetics upon onset of continuous actinic illumination. Spinach
chloroplasts with and without 1O- 5 M DCMU present in the suspension medium. Modulated
fluorescence yield measured with a PAM Fluorometer (Walz). Already in the dark,
DCMU addition causes some increase in the minimal fluorescence yield, F o. Maximal
yield, Fm, is induced upon illumination showing largely different kinetics with the two
samples. The hatched areas, bound by the broken line and the two curves, correspond to
the size of the acceptor pools available to PS II in control and DCMU-inhibited samples.
AL lOOIlEm-2s-1 650nm actinic light
1.0
QA
p=0.8
0.8
0.6
0.4
p=O
0.2
0.0
0.0 0.2 0.4 0.6 0.8
1.0
Fv
Fig. 3.3. Theoretical relationship between reduction of primary PS II acceptor, QA, and
variable fluorescence yield, Fv, based on the function Fv = (1 - p)QA -/(1 - QA - . p),
where the parameter p corresponds to different probabilities of energy transfer between
PS II units (Joliot and Joliot 1964). Note: in reality, the relationship is more complex due
to PS II heterogeneity. See text