

Predictions and Measurements of the Maximum Photosynthetic Rate
501
•
•
0.8
• •
•
0
• • ~
:g 0.6
....
• •
....
0
....
. !!!
•
0..
•
•
E 0.4
::J
•
•
::!:
•
0.2
•
a a 500 1000 1500 2000 2500 3000
Soil N (9 m· 2 )
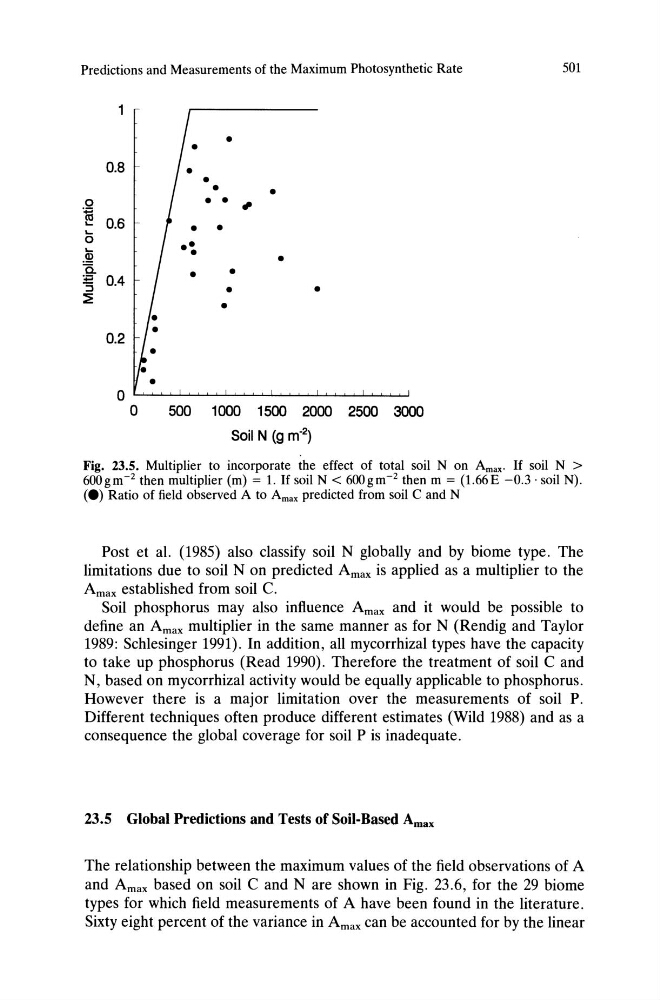
Fig. 23.5. Multiplier to incorporate the effect of total soil N on Amax. If soil N >
600gm- 2 then multiplier (m) = 1. If soil N < 600gm- 2 then m = (1.66E -0.3· soil N).
(e) Ratio of field observed A to Amax predicted from soil C and N
Post et al. (1985) also classify soil N globally and by biome type. The
limitations due to soil N on predicted Amax is applied as a multiplier to the
Amax established from soil C.
Soil phosphorus may also influence Amax and it would be possible to
define an Amax multiplier in the same manner as for N (Rendig and Taylor
1989: Schlesinger 1991). In addition, all mycorrhizal types have the capacity
to take up phosphorus (Read 1990). Therefore the treatment of soil C and
N, based on mycorrhizal activity would be equally applicable to phosphorus.
However there is a major limitation over the measurements of soil P.
Different techniques often produce different estimates (Wild 1988) and as a
consequence the global coverage for soil P is inadequate.
23.5 Global Predictions and Tests of Soil-Based Amax
The relationship between the maximum values of the field observations of A
and Amax based on soil C and N are shown in Fig. 23.6, for the 29 biome
types for which field measurements of A have been found in the literature.
Sixty eight percent of the variance in Amax can be accounted for by the linear
501
•
•
0.8
• •
•
0
• • ~
:g 0.6
....
• •
....
0
....
. !!!
•
0..
•
•
E 0.4
::J
•
•
::!:
•
0.2
•
a a 500 1000 1500 2000 2500 3000
Soil N (9 m· 2 )
Fig. 23.5. Multiplier to incorporate the effect of total soil N on Amax. If soil N >
600gm- 2 then multiplier (m) = 1. If soil N < 600gm- 2 then m = (1.66E -0.3· soil N).
(e) Ratio of field observed A to Amax predicted from soil C and N
Post et al. (1985) also classify soil N globally and by biome type. The
limitations due to soil N on predicted Amax is applied as a multiplier to the
Amax established from soil C.
Soil phosphorus may also influence Amax and it would be possible to
define an Amax multiplier in the same manner as for N (Rendig and Taylor
1989: Schlesinger 1991). In addition, all mycorrhizal types have the capacity
to take up phosphorus (Read 1990). Therefore the treatment of soil C and
N, based on mycorrhizal activity would be equally applicable to phosphorus.
However there is a major limitation over the measurements of soil P.
Different techniques often produce different estimates (Wild 1988) and as a
consequence the global coverage for soil P is inadequate.
23.5 Global Predictions and Tests of Soil-Based Amax
The relationship between the maximum values of the field observations of A
and Amax based on soil C and N are shown in Fig. 23.6, for the 29 biome
types for which field measurements of A have been found in the literature.
Sixty eight percent of the variance in Amax can be accounted for by the linear