

30
O. Bjorkman and B. Demmig-Adams
proportional to NRD. It should also be proportional to the concentration of
the quenching agent.
2.4.2.2 Comparison of Efficiencies and Rates of Energy Conversion
and Nonradiative Energy Dissipation Among Species
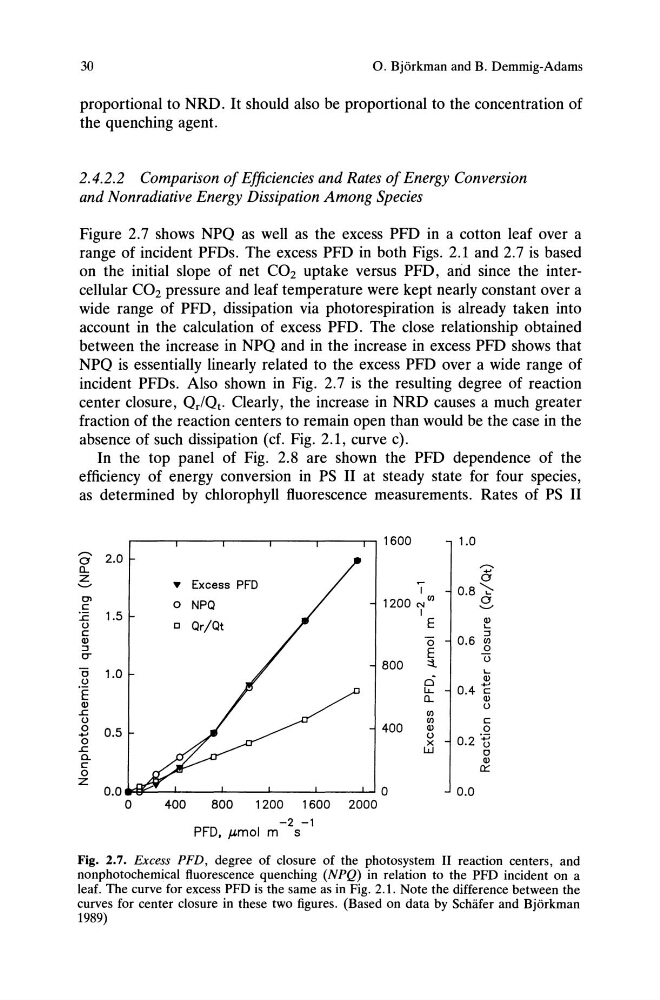
Figure 2.7 shows NPQ as well as the excess PFD in a cotton leaf over a
range of incident PFDs. The excess PFD in both Figs. 2.1 and 2.7 is based
on the initial slope of net CO2 uptake versus PFD, arid since the intercellular CO2 pressure and leaf temperature were kept nearly constant over a
wide range of PFD, dissipation via photo respiration is already taken into
account in the calculation of excess PFD. The close relationship obtained
between the increase in NPQ and in the increase in excess PFD shows that
NPQ is essentially linearly related to the excess PFD over a wide range of
incident PFDs. Also shown in Fig. 2.7 is the resulting degree of reaction
center closure, Qr/Qt. Clearly, the increase in NRD causes a much greater
fraction of the reaction centers to remain open than would be the case in the
absence of such dissipation (cf. Fig. 2.1, curve c).
In the top panel of Fig. 2.8 are shown the PFD dependence of the
efficiency of energy conversion in PS II at steady state for four species,
as determined by chlorophyll fluorescence measurements. Rates of PS II
1600
1.0
"'" 2.0
a
(l.
---.
Z
Excess PFD
5
'-"
~
I
0.8 ';::0>
NPQ
1200 N
en
a
c
0
'-"
:c 1.5
I
Qr/Qt
E
Q)
()
0
L
C
::J
Q)
0
0.6 ~
::J
E
cU
800
::t
"0 1.0
L
()
ci
Q)
' E
lL.
0.4 C
(l.
Q)
Q)
()
..c
en
()
en
c
0
0.5
400
Q)
0
+'
()
0.21:;
0
x
..c
w
0
0..
Q)
c
0:::
0
Z
0.0
0
0.0
0
400
800
1200 1600 2000
PFD, .umol m
-2 -1
s
Fig. 2.7. Excess PFD, degree of closure of the photosystem II reaction centers, and
nonphotochemical fluorescence quenching (NPQ) in relation to the PFD incident on a
leaf. The curve for excess PFD is the same as in Fig. 2.1. Note the difference between the
curves for center closure in these two figures. (Based on data by Schafer and Bjorkman
1989)
O. Bjorkman and B. Demmig-Adams
proportional to NRD. It should also be proportional to the concentration of
the quenching agent.
2.4.2.2 Comparison of Efficiencies and Rates of Energy Conversion
and Nonradiative Energy Dissipation Among Species
Figure 2.7 shows NPQ as well as the excess PFD in a cotton leaf over a
range of incident PFDs. The excess PFD in both Figs. 2.1 and 2.7 is based
on the initial slope of net CO2 uptake versus PFD, arid since the intercellular CO2 pressure and leaf temperature were kept nearly constant over a
wide range of PFD, dissipation via photo respiration is already taken into
account in the calculation of excess PFD. The close relationship obtained
between the increase in NPQ and in the increase in excess PFD shows that
NPQ is essentially linearly related to the excess PFD over a wide range of
incident PFDs. Also shown in Fig. 2.7 is the resulting degree of reaction
center closure, Qr/Qt. Clearly, the increase in NRD causes a much greater
fraction of the reaction centers to remain open than would be the case in the
absence of such dissipation (cf. Fig. 2.1, curve c).
In the top panel of Fig. 2.8 are shown the PFD dependence of the
efficiency of energy conversion in PS II at steady state for four species,
as determined by chlorophyll fluorescence measurements. Rates of PS II
1600
1.0
"'" 2.0
a
(l.
---.
Z
Excess PFD
5
'-"
~
I
0.8 ';::0>
NPQ
1200 N
en
a
c
0
'-"
:c 1.5
I
Qr/Qt
E
Q)
()
0
L
C
::J
Q)
0
0.6 ~
::J
E
cU
800
::t
"0 1.0
L
()
ci
Q)
' E
lL.
0.4 C
(l.
Q)
Q)
()
..c
en
()
en
c
0
0.5
400
Q)
0
+'
()
0.21:;
0
x
..c
w
0
0..
Q)
c
0:::
0
Z
0.0
0
0.0
0
400
800
1200 1600 2000
PFD, .umol m
-2 -1
s
Fig. 2.7. Excess PFD, degree of closure of the photosystem II reaction centers, and
nonphotochemical fluorescence quenching (NPQ) in relation to the PFD incident on a
leaf. The curve for excess PFD is the same as in Fig. 2.1. Note the difference between the
curves for center closure in these two figures. (Based on data by Schafer and Bjorkman
1989)