

Effects of Phenology, Physiology, and Gradients in Community Composition
445
8
32
Sphagnum
7
30
C(V cmax )
6
28
5
26
4 C(Pm I)
24
3
2
22
1 0
200
400
600
800
Water Content, % of dry weight
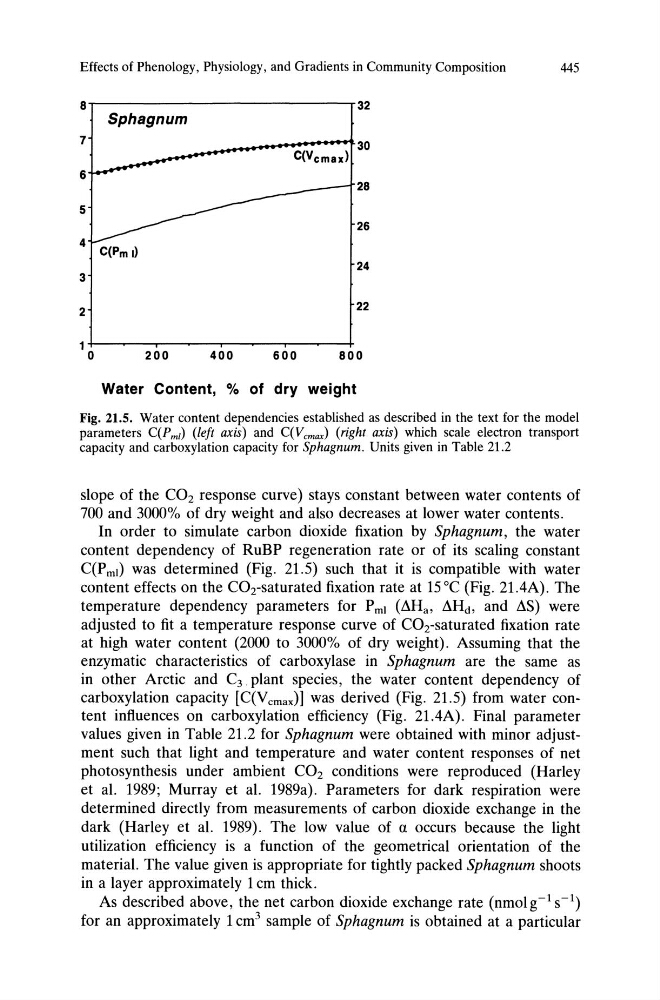
Fig. 21.5. Water content dependencies established as described in the text for the model
parameters C(P ml) (left axis) and C(Vcmax) (right axis) which scale electron transport
capacity and carboxylation capacity for Sphagnum. Units given in Table 21.2
slope of the CO2 response curve) stays constant between water contents of
700 and 3000% of dry weight and also decreases at lower water contents.
In order to simulate carbon dioxide fixation by Sphagnum, the water
content dependency of RuBP regeneration rate or of its scaling constant
C(P ml) was determined (Fig. 21.5) such that it is compatible with water
content effects on the COT saturated fixation rate at 15°C (Fig. 21.4A). The
temperature dependency parameters for P ml (L1Ha, L1Hd , and L1S) were
adjusted to fit a temperature response curve of COT saturated fixation rate
at high water content (2000 to 3000% of dry weight). Assuming that the
enzymatic characteristics of carboxylase in Sphagnum are the same as
in other Arctic and C3 . plant species, the water content dependency of
carboxylation capacity [C(Vcmax)] was derived (Fig. 21.5) from water content influences on carboxylation efficiency (Fig. 21.4A). Final parameter
values given in Table 21.2 for Sphagnum were obtained with minor adjustment such that light and temperature and water content responses of net
photosynthesis under ambient CO2 conditions were reproduced (Harley
et al. 1989; Murray et al. 1989a). Parameters for dark respiration were
determined directly from measurements of carbon dioxide exchange in the
dark (Harley et al. 1989). The low value of a occurs because the light
utilization efficiency is a function of the geometrical orientation of the
material. The value given is appropriate for tightly packed Sphagnum shoots
in a layer approximately 1 cm thick.
As described above, the net carbon dioxide exchange rate (nmolg- 1 S-l)
for an approximately 1 cm 3 sample of Sphagnum is obtained at a particular
445
8
32
Sphagnum
7
30
C(V cmax )
6
28
5
26
4 C(Pm I)
24
3
2
22
1 0
200
400
600
800
Water Content, % of dry weight
Fig. 21.5. Water content dependencies established as described in the text for the model
parameters C(P ml) (left axis) and C(Vcmax) (right axis) which scale electron transport
capacity and carboxylation capacity for Sphagnum. Units given in Table 21.2
slope of the CO2 response curve) stays constant between water contents of
700 and 3000% of dry weight and also decreases at lower water contents.
In order to simulate carbon dioxide fixation by Sphagnum, the water
content dependency of RuBP regeneration rate or of its scaling constant
C(P ml) was determined (Fig. 21.5) such that it is compatible with water
content effects on the COT saturated fixation rate at 15°C (Fig. 21.4A). The
temperature dependency parameters for P ml (L1Ha, L1Hd , and L1S) were
adjusted to fit a temperature response curve of COT saturated fixation rate
at high water content (2000 to 3000% of dry weight). Assuming that the
enzymatic characteristics of carboxylase in Sphagnum are the same as
in other Arctic and C3 . plant species, the water content dependency of
carboxylation capacity [C(Vcmax)] was derived (Fig. 21.5) from water content influences on carboxylation efficiency (Fig. 21.4A). Final parameter
values given in Table 21.2 for Sphagnum were obtained with minor adjustment such that light and temperature and water content responses of net
photosynthesis under ambient CO2 conditions were reproduced (Harley
et al. 1989; Murray et al. 1989a). Parameters for dark respiration were
determined directly from measurements of carbon dioxide exchange in the
dark (Harley et al. 1989). The low value of a occurs because the light
utilization efficiency is a function of the geometrical orientation of the
material. The value given is appropriate for tightly packed Sphagnum shoots
in a layer approximately 1 cm thick.
As described above, the net carbon dioxide exchange rate (nmolg- 1 S-l)
for an approximately 1 cm 3 sample of Sphagnum is obtained at a particular