

444
Sphagnum palustre
100
•
• • I
•
80
E
•
:::l
E
'x 60
c
E
'0
100 E
:::l
~
40
8
E
0
'x
J
0
c
50 E
20
'0
~ 0
UJ'
a
(J
1000
2000
3000
4000
A
Water Content, % of dry weight
in
40
en 30
'0 20
E
c
a:
z
Water
Content,
% of dry weight
B
•
-~ __ ~ __ ._~ __ ~_ J
a
500
1000
1500
Ca, IJbar
J.D. Tenhunen et al.
2000
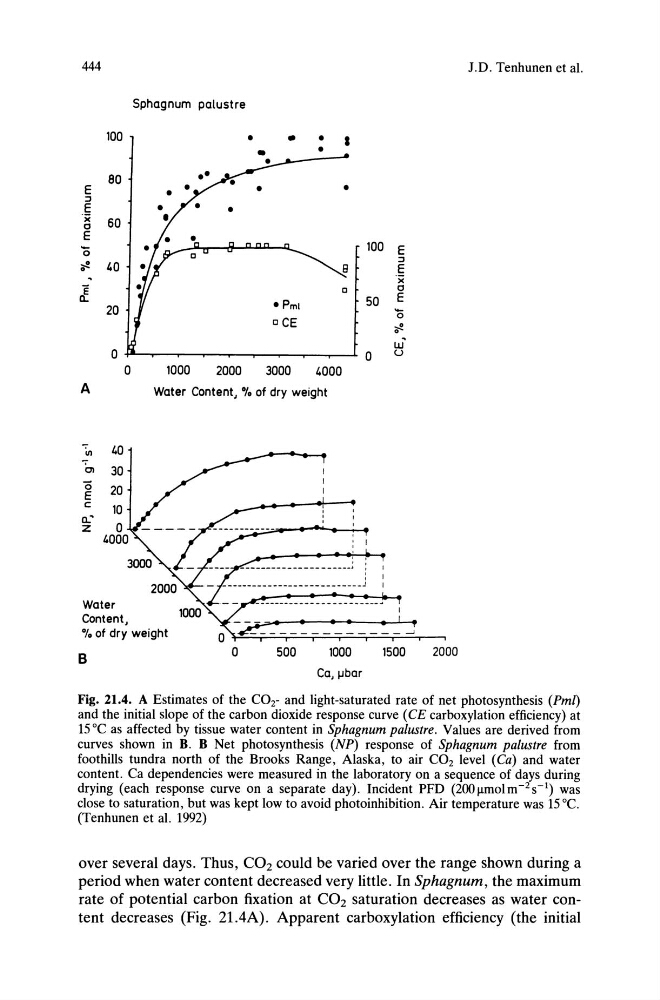
Fig. 21.4. A Estimates of the COz- and light-saturated rate of net photosynthesis (Pml)
and the initial slope of the carbon dioxide response curve (CE carboxylation efficiency) at
15°C as affected by tissue water content in Sphagnum palustre. Values are derived from
curves shown in B. B Net photosynthesis (NP) response of Sphagnum palustre from
foothills tundra north of the Brooks Range, Alaska, to air COz level (Ca) and water
content. Ca dependencies were measured in the laboratory on a sequence of days during
drying (each response curve on a separate day). Incident PFD (200Jlmolm- 2 s- 1 ) was
close to saturation, but was kept low to avoid photoinhibition. Air temperature was 15°C.
(Tenhunen et al. 1992)
over several days. Thus, CO2 could be varied over the range shown during a
period when water content decreased very little. In Sphagnum, the maximum
rate of potential carbon fixation at CO2 saturation decreases as water content decreases (Fig. 21.4A). Apparent carboxylation efficiency (the initial
Sphagnum palustre
100
•
• • I
•
80
E
•
:::l
E
'x 60
c
E
'0
100 E
:::l
~
40
8
E
0
'x
J
0
c
50 E
20
'0
~ 0
UJ'
a
(J
1000
2000
3000
4000
A
Water Content, % of dry weight
in
40
en 30
'0 20
E
c
a:
z
Water
Content,
% of dry weight
B
•
-~ __ ~ __ ._~ __ ~_ J
a
500
1000
1500
Ca, IJbar
J.D. Tenhunen et al.
2000
Fig. 21.4. A Estimates of the COz- and light-saturated rate of net photosynthesis (Pml)
and the initial slope of the carbon dioxide response curve (CE carboxylation efficiency) at
15°C as affected by tissue water content in Sphagnum palustre. Values are derived from
curves shown in B. B Net photosynthesis (NP) response of Sphagnum palustre from
foothills tundra north of the Brooks Range, Alaska, to air COz level (Ca) and water
content. Ca dependencies were measured in the laboratory on a sequence of days during
drying (each response curve on a separate day). Incident PFD (200Jlmolm- 2 s- 1 ) was
close to saturation, but was kept low to avoid photoinhibition. Air temperature was 15°C.
(Tenhunen et al. 1992)
over several days. Thus, CO2 could be varied over the range shown during a
period when water content decreased very little. In Sphagnum, the maximum
rate of potential carbon fixation at CO2 saturation decreases as water content decreases (Fig. 21.4A). Apparent carboxylation efficiency (the initial