

420
May
E
o
30
P.d.
"tJ
PF0 tol 7.6
§ 27
E.r.
17.5
o
~ 21
CD
>
o
.0
o
E
o
"tJ
15
9
3
30
§ 27
o
~ 21
.,
>
o
.0
o
-
..c
01
. .
:J:
15
9
3
~
I
I
I
I
5.0
0
5.0
May
80
0
80
June
5.0
o 5.0
-2 -1
intercepted pro, mol m d
June
80
0
80
-2 -1
Aeon' mmol m d
W. Beyschlag et al.
October
P.d.
4.0
5.0
o
E.r.
5.0
October
P.d.
E.r.
12
80
o 80
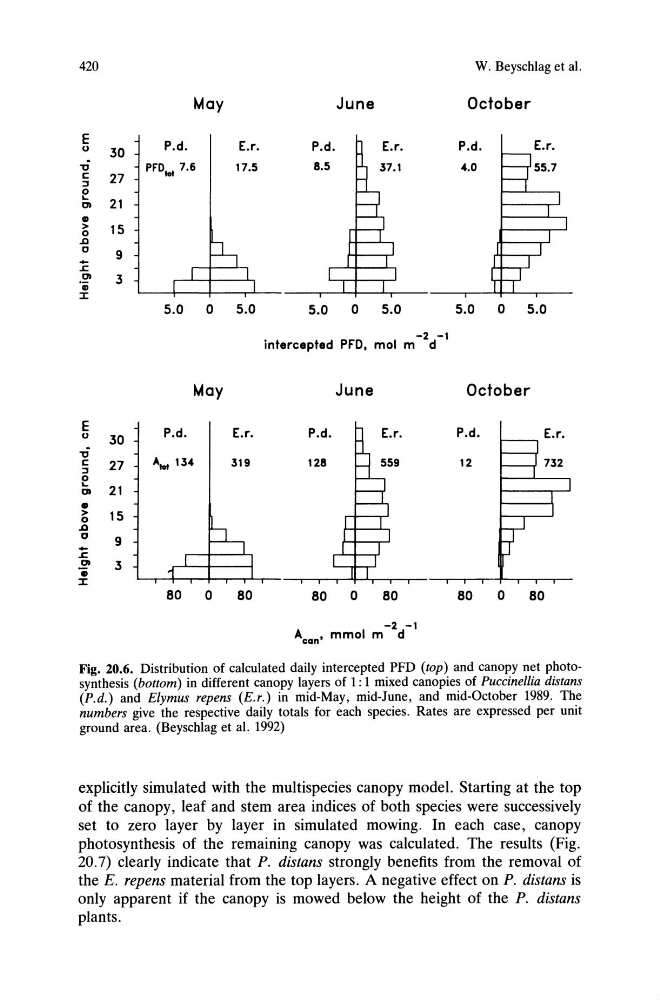
Fig. 20.6. Distribution of calculated daily intercepted PFD (top) and canopy net photosynthesis (bottom) in different canopy layers of 1: 1 mixed canopies of Puccinellia distans
(P.d.) and Elymus repens (E.r.) in mid-May, mid-June, and mid-October 1989. The
numbers give the respective daily totals for each species. Rates are expressed per unit
ground area. (Beyschlag et al. 1992)
explicitly simulated with the multispecies canopy model. Starting at the top
of the canopy, leaf and stem area indices of both species were successively
set to zero layer by layer in simulated mowing. In each case, canopy
photosynthesis of the remaining canopy was calculated. The results (Fig.
20.7) clearly indicate that P. distans strongly benefits from the removal of
the E. repens material from the top layers. A negative effect on P. distans is
only apparent if the canopy is mowed below the height of the P. distans
plants.
May
E
o
30
P.d.
"tJ
PF0 tol 7.6
§ 27
E.r.
17.5
o
~ 21
CD
>
o
.0
o
E
o
"tJ
15
9
3
30
§ 27
o
~ 21
.,
>
o
.0
o
-
..c
01
. .
:J:
15
9
3
~
I
I
I
I
5.0
0
5.0
May
80
0
80
June
5.0
o 5.0
-2 -1
intercepted pro, mol m d
June
80
0
80
-2 -1
Aeon' mmol m d
W. Beyschlag et al.
October
P.d.
4.0
5.0
o
E.r.
5.0
October
P.d.
E.r.
12
80
o 80
Fig. 20.6. Distribution of calculated daily intercepted PFD (top) and canopy net photosynthesis (bottom) in different canopy layers of 1: 1 mixed canopies of Puccinellia distans
(P.d.) and Elymus repens (E.r.) in mid-May, mid-June, and mid-October 1989. The
numbers give the respective daily totals for each species. Rates are expressed per unit
ground area. (Beyschlag et al. 1992)
explicitly simulated with the multispecies canopy model. Starting at the top
of the canopy, leaf and stem area indices of both species were successively
set to zero layer by layer in simulated mowing. In each case, canopy
photosynthesis of the remaining canopy was calculated. The results (Fig.
20.7) clearly indicate that P. distans strongly benefits from the removal of
the E. repens material from the top layers. A negative effect on P. distans is
only apparent if the canopy is mowed below the height of the P. distans
plants.