

352
R.W. Pearcy and W.A. Ptitsch
-32
13
+ 0.413 (dir PFD) 0
c5 C = -35.09
2
r = 0.71
-33
,.-.,..
0
0
~
' - . / -34
0
0
U
I"")
..CO
0
I
-35
0
shaded plants
-36
0
2
4
6
(mol
--2
-1
Direct PFD
m
day )
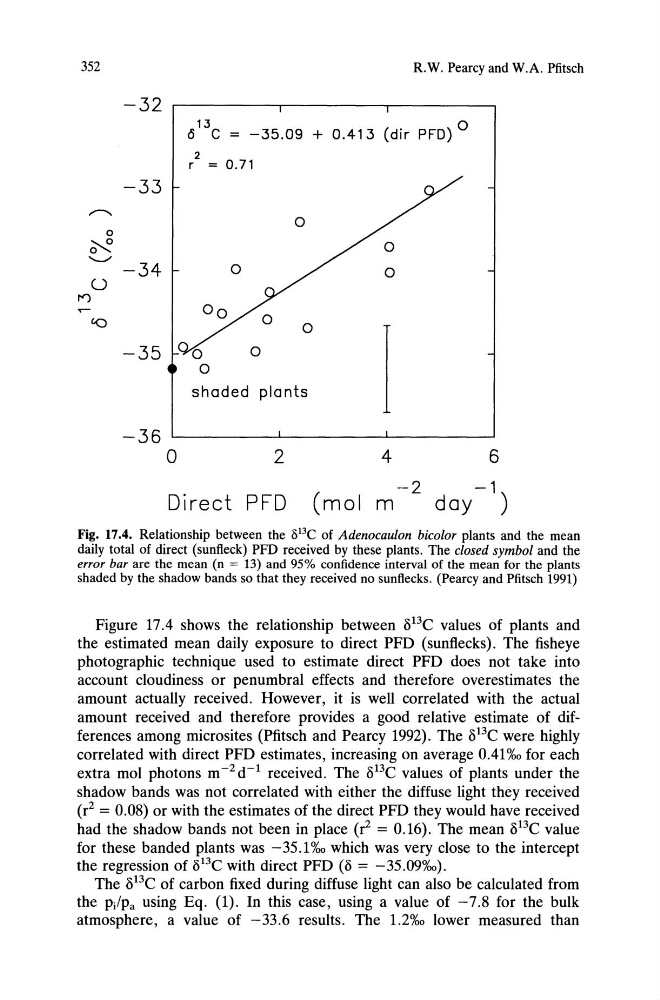
Fig. 17.4. Relationship between the /)13e of Adenocaulon bicolor plants and the mean
daily total of direct (sunfleck) PFD received by these plants. The closed symbol and the
error bar are the mean (n = 13) and 95% confidence interval of the mean for the plants
shaded by the shadow bands so that they received no sunflecks. (Pearcy and Pfitsch 1991)
Figure 17.4 shows the relationship between 013C values of plants and
the estimated mean daily exposure to direct PFD (sunftecks). The fisheye
photographic technique used to estimate direct PFD does not take into
account cloudiness or penumbral effects and therefore overestimates the
amount actually received. However, it is well correlated with the actual
amount received and therefore provides a good relative estimate of differences among micro sites (Pfitsch and Pearcy 1992). The 013C were highly
correlated with direct PFD estimates, increasing on average 0.41%0 for each
extra mol photons m- 2 d- 1 received. The 013C values of plants under the
shadow bands was not correlated with either the diffuse light they received
(r2 = 0.08) or with the estimates of the direct PFD they would have received
had the shadow bands not been in place (r2 = 0.16). The mean 013C value
for these banded plants was - 35.1 %0 which was very close to the intercept
the regression of 013C with direct PFD (8 = -35.09%0).
The 013C of carbon fixed during diffuse light can also be calculated from
the p;lPa using Eq. (1). In this case, using a value of -7.8 for the bulk
atmosphere, a value of -33.6 results. The 1.2%0 lower measured than
R.W. Pearcy and W.A. Ptitsch
-32
13
+ 0.413 (dir PFD) 0
c5 C = -35.09
2
r = 0.71
-33
,.-.,..
0
0
~
' - . / -34
0
0
U
I"")
..CO
0
I
-35
0
shaded plants
-36
0
2
4
6
(mol
--2
-1
Direct PFD
m
day )
Fig. 17.4. Relationship between the /)13e of Adenocaulon bicolor plants and the mean
daily total of direct (sunfleck) PFD received by these plants. The closed symbol and the
error bar are the mean (n = 13) and 95% confidence interval of the mean for the plants
shaded by the shadow bands so that they received no sunflecks. (Pearcy and Pfitsch 1991)
Figure 17.4 shows the relationship between 013C values of plants and
the estimated mean daily exposure to direct PFD (sunftecks). The fisheye
photographic technique used to estimate direct PFD does not take into
account cloudiness or penumbral effects and therefore overestimates the
amount actually received. However, it is well correlated with the actual
amount received and therefore provides a good relative estimate of differences among micro sites (Pfitsch and Pearcy 1992). The 013C were highly
correlated with direct PFD estimates, increasing on average 0.41%0 for each
extra mol photons m- 2 d- 1 received. The 013C values of plants under the
shadow bands was not correlated with either the diffuse light they received
(r2 = 0.08) or with the estimates of the direct PFD they would have received
had the shadow bands not been in place (r2 = 0.16). The mean 013C value
for these banded plants was - 35.1 %0 which was very close to the intercept
the regression of 013C with direct PFD (8 = -35.09%0).
The 013C of carbon fixed during diffuse light can also be calculated from
the p;lPa using Eq. (1). In this case, using a value of -7.8 for the bulk
atmosphere, a value of -33.6 results. The 1.2%0 lower measured than