

348
R.W. Pearcy and W.A. Pfitsch
saturate these particular Adenocaulon leaves (200-400 Ilmol m -2 s - \ see the
horizontal lines on the left side of Fig. 17.1).
Integration of the curves in Fig. 17.1 gives the total daily carbon gain.
Since the diffuse light levels in the understory were low and fairly constant,
and the response to sunflecks was distinctly resolved, it was possible to
separate the assimilation due to sunfleck utilization from that due to utilization of diffuse light alone. Total daily carbon gain ranged from 15 to
43mmolm- 2 d- 1 . Measurements on another day not shown in Fig. 17.1
were done with the chamber shaded by a circular disc mounted away from
I
C\I
I
>o
"U
E
o
E
E
60 .-------,-------,-------,-------,
40
o measured
• predicted
•
o
•
o
E
'-"
D ~
A
c
o
+-'
o
E
Cf)
Cf)
o
>o
"U
o
20
~
F
0
0.0
•
0
• B
0
C
I
I
0.5
1.0
1.5
2.0
o
-2
-1
ITotal Daily PFD (mol m
day )
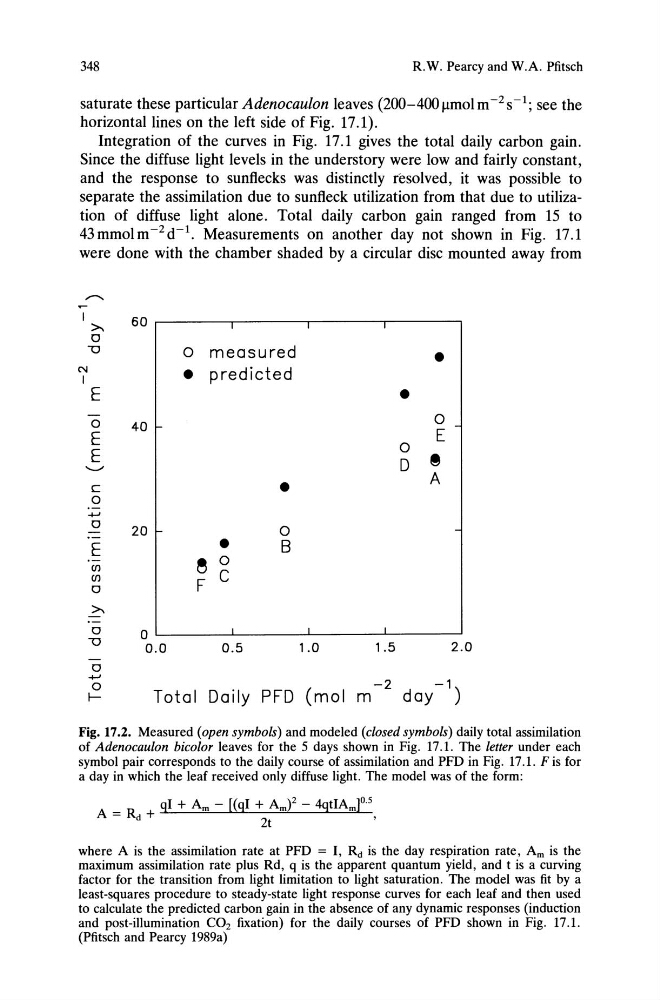
Fig. 17.2. Measured (open symbols) and modeled (closed symbols) daily total assimilation
of Adenocaulon bicolor leaves for the 5 days shown in Fig. 17.1. The letter under each
symbol pair corresponds to the daily course of assimilation and PFD in Fig. 17.1. F is for
a day in which the leaf received only diffuse light. The model was of the form:
where A is the assimilation rate at PFD = I, Rd is the day respiration rate, Am is the
maximum assimilation rate plus Rd, q is the apparent quantum yield, and t is a curving
factor for the transition from light limitation to light saturation. The model was fit by a
least-squares procedure to steady-state light response curves for each leaf and then used
to calculate the predicted carbon gain in the absence of any dynamic responses (induction
and post-illumination CO2 fixation) for the daily courses of PFD shown in Fig. 17.1.
(Pfitsch and Pearcy 1989a)
R.W. Pearcy and W.A. Pfitsch
saturate these particular Adenocaulon leaves (200-400 Ilmol m -2 s - \ see the
horizontal lines on the left side of Fig. 17.1).
Integration of the curves in Fig. 17.1 gives the total daily carbon gain.
Since the diffuse light levels in the understory were low and fairly constant,
and the response to sunflecks was distinctly resolved, it was possible to
separate the assimilation due to sunfleck utilization from that due to utilization of diffuse light alone. Total daily carbon gain ranged from 15 to
43mmolm- 2 d- 1 . Measurements on another day not shown in Fig. 17.1
were done with the chamber shaded by a circular disc mounted away from
I
C\I
I
>o
"U
E
o
E
E
60 .-------,-------,-------,-------,
40
o measured
• predicted
•
o
•
o
E
'-"
D ~
A
c
o
+-'
o
E
Cf)
Cf)
o
>o
"U
o
20
~
F
0
0.0
•
0
• B
0
C
I
I
0.5
1.0
1.5
2.0
o
-2
-1
ITotal Daily PFD (mol m
day )
Fig. 17.2. Measured (open symbols) and modeled (closed symbols) daily total assimilation
of Adenocaulon bicolor leaves for the 5 days shown in Fig. 17.1. The letter under each
symbol pair corresponds to the daily course of assimilation and PFD in Fig. 17.1. F is for
a day in which the leaf received only diffuse light. The model was of the form:
where A is the assimilation rate at PFD = I, Rd is the day respiration rate, Am is the
maximum assimilation rate plus Rd, q is the apparent quantum yield, and t is a curving
factor for the transition from light limitation to light saturation. The model was fit by a
least-squares procedure to steady-state light response curves for each leaf and then used
to calculate the predicted carbon gain in the absence of any dynamic responses (induction
and post-illumination CO2 fixation) for the daily courses of PFD shown in Fig. 17.1.
(Pfitsch and Pearcy 1989a)