

The Consequences of Sunflecks for Photosynthesis
347
1600
A
A
1200
6
800
4
400
0
-
j~
1
2
0
1600
B
B
1200
6
r--.
800
~
4
I
~
I
400
en
N
0
I
-
J,.J
LIJ
en
N
2
I E 0
E 1600
c
N
c
en 1200
c
0
6
U
0
..... 800
0
.c
0
4
E
a. 400
0
0
-~
::t 2
'-"
c
E
::t 1600
'-"
0
1200
i.J...
0...
800
400
0
0
~
0
0
.....
0
6
E
en
4
en
«
2
o
0
1600
E
E
1200
6
800
400
0 -LL
4
2
0
6
8
10
12
14
16
18
6
8
16
18
Time (hour)
Time (hour)
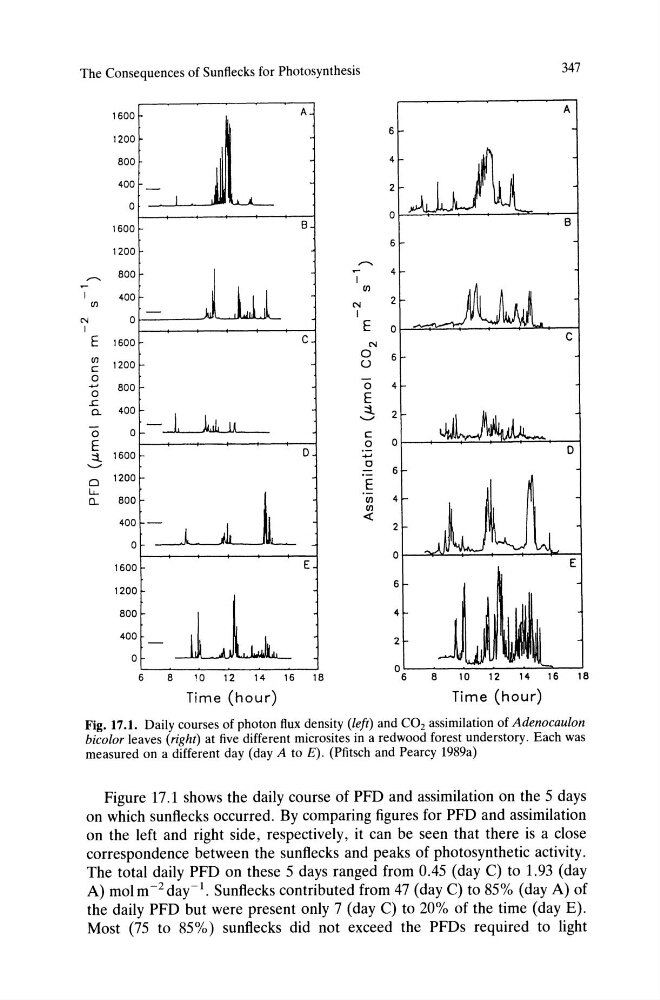
Fig. 17.1. Daily courses of photon flux density (left) and CO2 assimilation of Adenocaulon
hicolor leaves (right) at five different microsites in a redwood forest understory. Each was
measured on a different day (day A to E). (Pfitsch and Pearcy 1989a)
Figure 17.1 shows the daily course of PFO and assimilation on the 5 days
on which sunftecks occurred. By comparing figures for PFO and assimilation
on the left and right side, respectively, it can be seen that there is a close
correspondence between the sunftecks and peaks of photosynthetic activity.
The total daily PFO on these 5 days ranged from 0.45 (day C) to 1.93 (day
A) molm~2day~1. Sunftecks contributed from 47 (day C) to 85% (day A) of
the daily PFO but were present only 7 (day C) to 20% of the time (day E).
Most (75 to 85%) sunftecks did not exceed the PFOs required to light
347
1600
A
A
1200
6
800
4
400
0
-
j~
1
2
0
1600
B
B
1200
6
r--.
800
~
4
I
~
I
400
en
N
0
I
-
J,.J
LIJ
en
N
2
I E 0
E 1600
c
N
c
en 1200
c
0
6
U
0
..... 800
0
.c
0
4
E
a. 400
0
0
-~
::t 2
'-"
c
E
::t 1600
'-"
0
1200
i.J...
0...
800
400
0
0
~
0
0
.....
0
6
E
en
4
en
«
2
o
0
1600
E
E
1200
6
800
400
0 -LL
4
2
0
6
8
10
12
14
16
18
6
8
16
18
Time (hour)
Time (hour)
Fig. 17.1. Daily courses of photon flux density (left) and CO2 assimilation of Adenocaulon
hicolor leaves (right) at five different microsites in a redwood forest understory. Each was
measured on a different day (day A to E). (Pfitsch and Pearcy 1989a)
Figure 17.1 shows the daily course of PFO and assimilation on the 5 days
on which sunftecks occurred. By comparing figures for PFO and assimilation
on the left and right side, respectively, it can be seen that there is a close
correspondence between the sunftecks and peaks of photosynthetic activity.
The total daily PFO on these 5 days ranged from 0.45 (day C) to 1.93 (day
A) molm~2day~1. Sunftecks contributed from 47 (day C) to 85% (day A) of
the daily PFO but were present only 7 (day C) to 20% of the time (day E).
Most (75 to 85%) sunftecks did not exceed the PFOs required to light