

320
T.G.A. Green and O.L. Lange
Kappen (1973, 1988) and Longton (1988). No previous work seems to have
compared and analyzed lichens and bryophytes on the basis of their
photosynthetic features. It is hoped that such an analysis could provide
insights into several aspects of the groups, for instance, similarities that
might explain coexistence, or characteristics that favor one group over the
other in certain habitats.
16.2 CO2 Exchange of Lichens and Bryophytes
16.2.1 Net Photosynthetic Rates
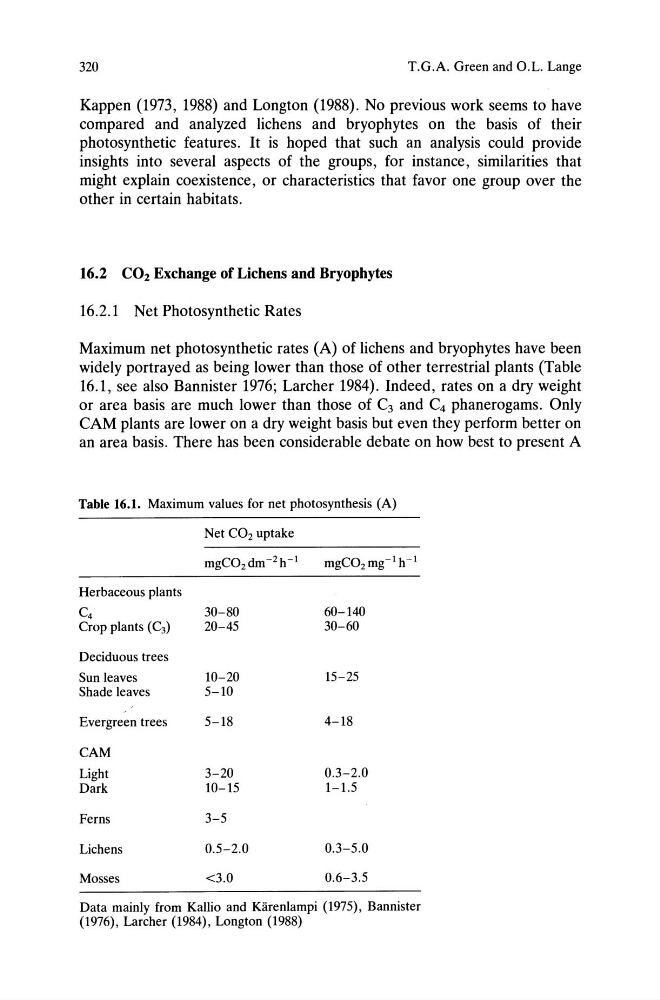
Maximum net photosynthetic rates (A) of lichens and bryophytes have been
widely portrayed as being lower than those of other terrestrial plants (Table
16.1, see also Bannister 1976; Larcher 1984). Indeed, rates on a dry weight
or area basis are much lower than those of C3 and C4 phanerogams. Only
CAM plants are lower on a dry weight basis but even they perform better on
an area basis. There has been considerable debate on how best to present A
Table 16.1. Maximum values for net photosynthesis (A)
Net CO2 uptake
mgC0 2 dm- 2 h- 1
mgC0 2 mg- 1 h- 1
Herbaceous plants
C4
30-80
60-140
Crop plants (C3)
20-45
30-60
Deciduous trees
Sun leaves
10-20
15-25
Shade leaves
5-10
Evergreen trees
5-18
4-18
CAM
Light
3-20
0.3-2.0
Dark
10-15
1-1.5
Ferns
3-5
Lichens
0.5-2.0
0.3-5.0
Mosses
<3.0
0.6-3.5
Data mainly from Kallio and Kiirenlampi (1975), Bannister
(1976), Larcher (1984), Longton (1988)
T.G.A. Green and O.L. Lange
Kappen (1973, 1988) and Longton (1988). No previous work seems to have
compared and analyzed lichens and bryophytes on the basis of their
photosynthetic features. It is hoped that such an analysis could provide
insights into several aspects of the groups, for instance, similarities that
might explain coexistence, or characteristics that favor one group over the
other in certain habitats.
16.2 CO2 Exchange of Lichens and Bryophytes
16.2.1 Net Photosynthetic Rates
Maximum net photosynthetic rates (A) of lichens and bryophytes have been
widely portrayed as being lower than those of other terrestrial plants (Table
16.1, see also Bannister 1976; Larcher 1984). Indeed, rates on a dry weight
or area basis are much lower than those of C3 and C4 phanerogams. Only
CAM plants are lower on a dry weight basis but even they perform better on
an area basis. There has been considerable debate on how best to present A
Table 16.1. Maximum values for net photosynthesis (A)
Net CO2 uptake
mgC0 2 dm- 2 h- 1
mgC0 2 mg- 1 h- 1
Herbaceous plants
C4
30-80
60-140
Crop plants (C3)
20-45
30-60
Deciduous trees
Sun leaves
10-20
15-25
Shade leaves
5-10
Evergreen trees
5-18
4-18
CAM
Light
3-20
0.3-2.0
Dark
10-15
1-1.5
Ferns
3-5
Lichens
0.5-2.0
0.3-5.0
Mosses
<3.0
0.6-3.5
Data mainly from Kallio and Kiirenlampi (1975), Bannister
(1976), Larcher (1984), Longton (1988)