

Helianthus annuus
Bayreuth, 1992
100
Xylem sap ABA (~mol I -1 )
400
2.5
75
300
50
200
25
100
A
- ~
o
O...l.---r--.----,.--.----r--.----,.--+-O
-
100
400
75
300
50
200
25
100
8
Phloem transport
o ....L..._~-~-~___..-~-_._-.....--+- 0
400
100
300
75
50
200
25
100
c
Photon flux density (m -2 s -1 )
o
o
2
3
4
5
6
7
Time after end of feeding, ABA
- "j" en
N
I
E
~
E
- Q)
o
c::
~ ::l
"'C
c::
8
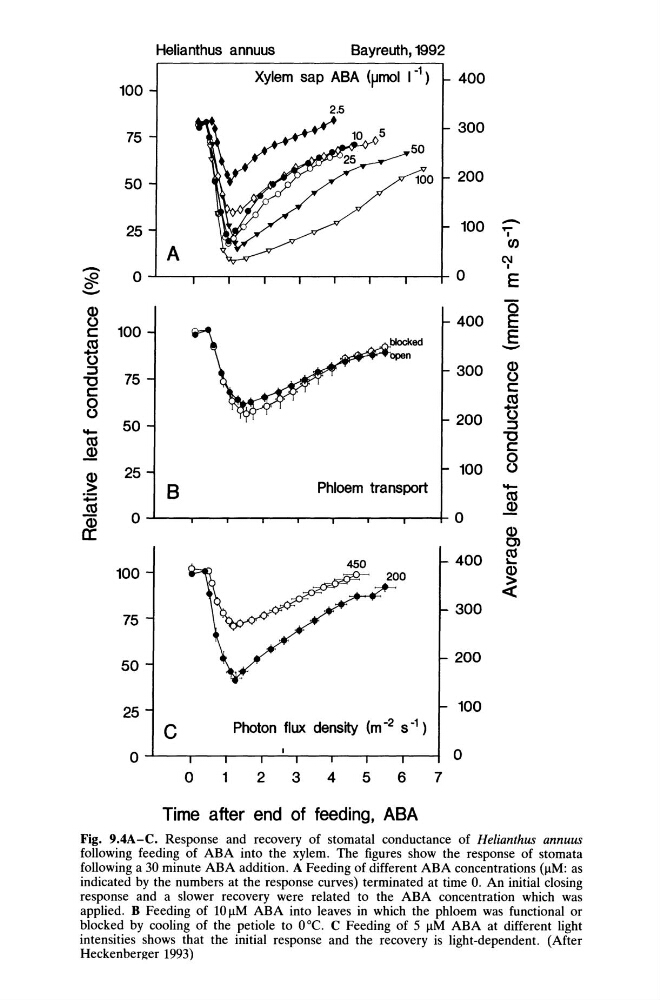
Fig. 9.4A-C. Response and recovery of stomatal conductance of Helianthus annuus
following feeding of ABA into the xylem. The figures show the response of stomata
following a 30 minute ABA addition. A Feeding of different ABA concentrations (IlM: as
indicated by the numbers at the response curves) terminated at time O. An initial closing
response and a slower recovery were related to the ABA concentration which was
applied. B Feeding of 10 IlM ABA into leaves in which the phloem was functional or
blocked by cooling of the petiole to ooe. C Feeding of 5 IlM ABA at different light
intensities shows that the initial response and the recovery is light-dependent. (After
Heckenberger 1993)
Bayreuth, 1992
100
Xylem sap ABA (~mol I -1 )
400
2.5
75
300
50
200
25
100
A
- ~
o
O...l.---r--.----,.--.----r--.----,.--+-O
-
100
400
75
300
50
200
25
100
8
Phloem transport
o ....L..._~-~-~___..-~-_._-.....--+- 0
400
100
300
75
50
200
25
100
c
Photon flux density (m -2 s -1 )
o
o
2
3
4
5
6
7
Time after end of feeding, ABA
- "j" en
N
I
E
~
E
- Q)
o
c::
~ ::l
"'C
c::
8
Fig. 9.4A-C. Response and recovery of stomatal conductance of Helianthus annuus
following feeding of ABA into the xylem. The figures show the response of stomata
following a 30 minute ABA addition. A Feeding of different ABA concentrations (IlM: as
indicated by the numbers at the response curves) terminated at time O. An initial closing
response and a slower recovery were related to the ABA concentration which was
applied. B Feeding of 10 IlM ABA into leaves in which the phloem was functional or
blocked by cooling of the petiole to ooe. C Feeding of 5 IlM ABA at different light
intensities shows that the initial response and the recovery is light-dependent. (After
Heckenberger 1993)