

166
J.S. Pereira
We may use Eq. (7) to summarize how water deficits change the relationship between A and growth even though it does not allow any kinetic
simulation of growth. From what was written above, water deficits will result
in reduced growth because p increases and A decreases with water deficits.
In many cases, changes in A result from stomatal closure decreasing
maximum conductance and increasing the afternoon depression in conductance. In the long term, decrease in the photosynthesis of the whole
canopy may occur, possibly due to aging of foliage and leaf shedding. The
reasons for the changes in the respiration term of Eq. (7), <1>, are not clear
because only a few studies are available on respiration. It is likely, however,
that in spite of the decline in the instantaneous rates of respiration, a greater
percentage of carbon fixed goes to respiration under water stress, because of
the decrease in photosynthetic rates. Changes in plant structure, leaf area,
and the level of stored carbohydrates and nutrients will hamper the full
recovery of growth rates after water deficits are alleviated even if gas
exchange rates are restored. A great variety of responses may be expected,
however, from much slower growth compared to well-watered controls to
faster growth rates. The latter may result, for example, from previously
water-stressed plants being smaller and having therefore less self-shading of
foliage. In addition, the initiation of growth may create a greater sink
capacity and the stimulation of A in the previously water-stressed plants.
8.8.2 Nitrogen Abundance
Nitrogen is often the major growth-limiting nutrient, and its effects on
growth have been extensively studied. About 75% of the element in a C 3
plant leaf is allocated to the chloroplast (Chapin et ai. 1987) and it is often
found that photosynthetic rate of single leaves increases with nitrogen concentration in tissues (Field 1983; Field and Mooney 1986; Evans 1989, 1990;
Sinclair and Horie 1989). However, the reverse may occur as well (e.g.,
Sheriff et aI., 1986) if, for example, a lower proportion of tissue nitrogen
concentration is allocated to the photosynthetic apparatus (thylakoids plus
soluble protein) (Osmond 1987; Evans 1990).
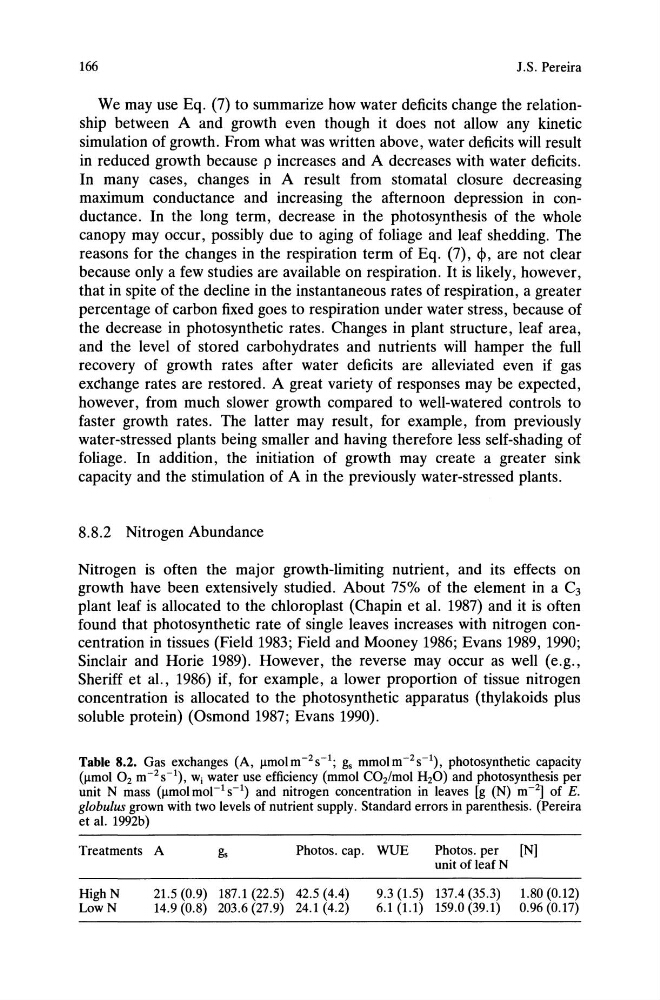
Table 8.2. Gas exchanges (A, !lmolm-zs-l; gs mmolm- Z s- 1 ), photosynthetic capacity
(!lmol Oz m- z s-1), Wi water use efficiency (mmol COz/mol HzO) and photosynthesis per
unit N mass (!lmol mol- 1 S-1) and nitrogen concentration in leaves [g (N) m- Z ] of E.
globulus grown with two levels of nutrient supply. Standard errors in parenthesis. (Pereira
et al. 1992b)
Treatments A
gs
Photos. cap. WUE
Photos. per
[N]
HighN
LowN
21.5 (0.9) 187.1 (22.5) 42.5 (4.4)
14.9 (0.8) 203.6 (27.9) 24.1 (4.2)
unit of leaf N
9.3 (1.5) 137.4 (35.3)
6.1 (1.1) 159.0 (39.1)
1.80 (0.12)
0.96 (0.17)
J.S. Pereira
We may use Eq. (7) to summarize how water deficits change the relationship between A and growth even though it does not allow any kinetic
simulation of growth. From what was written above, water deficits will result
in reduced growth because p increases and A decreases with water deficits.
In many cases, changes in A result from stomatal closure decreasing
maximum conductance and increasing the afternoon depression in conductance. In the long term, decrease in the photosynthesis of the whole
canopy may occur, possibly due to aging of foliage and leaf shedding. The
reasons for the changes in the respiration term of Eq. (7), <1>, are not clear
because only a few studies are available on respiration. It is likely, however,
that in spite of the decline in the instantaneous rates of respiration, a greater
percentage of carbon fixed goes to respiration under water stress, because of
the decrease in photosynthetic rates. Changes in plant structure, leaf area,
and the level of stored carbohydrates and nutrients will hamper the full
recovery of growth rates after water deficits are alleviated even if gas
exchange rates are restored. A great variety of responses may be expected,
however, from much slower growth compared to well-watered controls to
faster growth rates. The latter may result, for example, from previously
water-stressed plants being smaller and having therefore less self-shading of
foliage. In addition, the initiation of growth may create a greater sink
capacity and the stimulation of A in the previously water-stressed plants.
8.8.2 Nitrogen Abundance
Nitrogen is often the major growth-limiting nutrient, and its effects on
growth have been extensively studied. About 75% of the element in a C 3
plant leaf is allocated to the chloroplast (Chapin et ai. 1987) and it is often
found that photosynthetic rate of single leaves increases with nitrogen concentration in tissues (Field 1983; Field and Mooney 1986; Evans 1989, 1990;
Sinclair and Horie 1989). However, the reverse may occur as well (e.g.,
Sheriff et aI., 1986) if, for example, a lower proportion of tissue nitrogen
concentration is allocated to the photosynthetic apparatus (thylakoids plus
soluble protein) (Osmond 1987; Evans 1990).
Table 8.2. Gas exchanges (A, !lmolm-zs-l; gs mmolm- Z s- 1 ), photosynthetic capacity
(!lmol Oz m- z s-1), Wi water use efficiency (mmol COz/mol HzO) and photosynthesis per
unit N mass (!lmol mol- 1 S-1) and nitrogen concentration in leaves [g (N) m- Z ] of E.
globulus grown with two levels of nutrient supply. Standard errors in parenthesis. (Pereira
et al. 1992b)
Treatments A
gs
Photos. cap. WUE
Photos. per
[N]
HighN
LowN
21.5 (0.9) 187.1 (22.5) 42.5 (4.4)
14.9 (0.8) 203.6 (27.9) 24.1 (4.2)
unit of leaf N
9.3 (1.5) 137.4 (35.3)
6.1 (1.1) 159.0 (39.1)
1.80 (0.12)
0.96 (0.17)