

140
K. Fichtner et al.
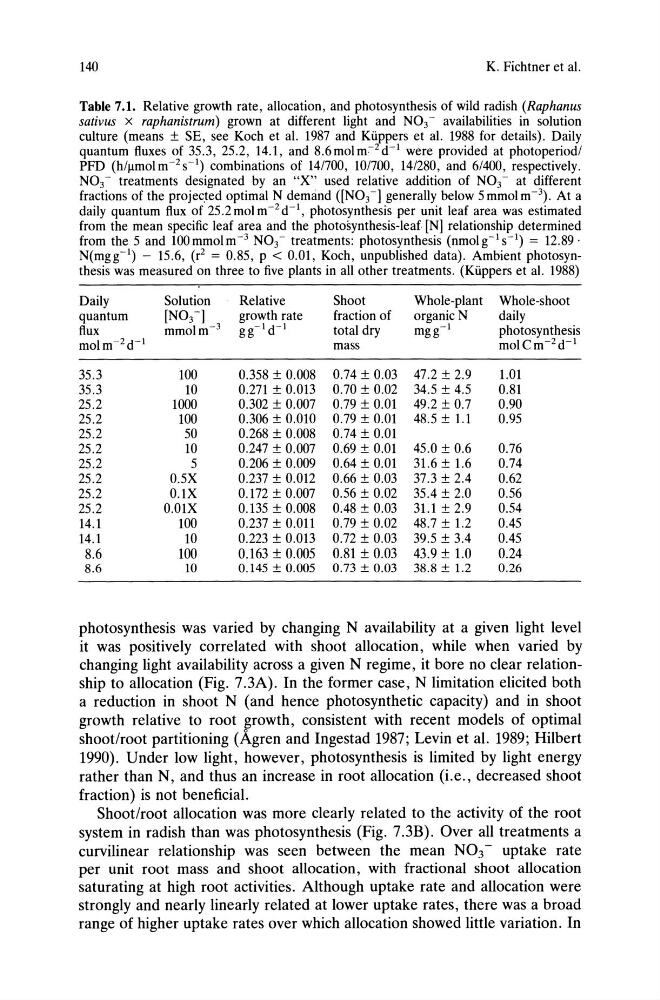
Table 7.1. Relative growth rate, allocation, and photosynthesis of wild radish (Raphanus
sativus x raphanistrum) grown at different light and N03 - availabilities in solution
culture (means ± SE, see Koch et al. 1987 and Kiippers et al. 1988 for details). Daily
quantum fluxes of 35.3, 25.2, 14.1, and 8.6molm:- 2 d- 1 were provided at photoperiod 1
PFD (h/llmol m- 2 S-I) combinations of 14/700, 10/700, 14/280, and 61400, respectively.
N0 3 - treatments designated by an "X" used relative addition of N03 - at different
fractions of the projec.ted optimal N demand ([N03 -] generally below 5 mmolm- 3 ). At a
daily quantum flux of 25.2 mol m- 2 d-l, photosynthesis per unit leaf area was estimated
from the mean specific leaf area and the photosynthesis-leaf [N] relationship determined
from the 5 and 100mmolm- 3 N0 3 - treatments: photosynthesis (nmolg- 1 s-l) = 12.89·
N(mgg-l) - 15.6, (r2 = 0.85, p < 0.01, Koch, unpublished data). Ambient photosynthesis was measured on three to five plants in all other treatments. (Kiippers et al. 1988)
Daily
Solution
Relative
Shoot
Whole-plant Whole-shoot
quantum
[N0 3 -]
growth rate
fraction of
organic N
daily
flux
mmolm- 3 gg-1 d-1
total dry
mgg- 1
photosynthesis
molm- 2 d- 1
mass
moICm- 2 d- 1
35.3
100
0.358 ± 0.008 0.74 ± 0.03 47.2 ± 2.9
1.01
35.3
10
0.271 ± 0.013 0.70 ± 0.02 34.5 ± 4.5
0.81
25.2
1000
0.302 ± 0.007 0.79 ± 0.01 49.2 ± 0.7
0.90
25.2
100
0.306 ± 0.010 0.79 ± 0.01 48.5 ± 1.1
0.95
25.2
50
0.268 ± 0.008 0.74 ± 0.01
25.2
10
0.247 ± 0.007 0.69 ± 0.01 45.0 ± 0.6
0.76
25.2
5
0.206 ± 0.009 0.64 ± 0.01 31.6 ± 1.6
0.74
25.2
0.5X
0.237 ± 0.012 0.66 ± 0.03 37.3 ± 2.4
0.62
25.2
O.IX
0.172 ± 0.007 0.56 ± 0.02 35.4 ± 2.0
0.56
25.2
O.OIX
0.135 ± 0.008 0.48 ± 0.03 31.1 ± 2.9
0.54
14.1
100
0.237 ± 0.011 0.79 ± 0.02 48.7 ± 1.2
0.45
14.1
10
0.223 ± 0.013 0.72 ± 0.03 39.5 ± 3.4
0.45
8.6
100
0.163 ± 0.005 0.81 ± 0.03 43.9 ± 1.0
0.24
8.6
10
0.145 ± 0.005 0.73 ± 0.03 38.8 ± 1.2
0.26
photosynthesis was varied by changing N availability at a given light level
it was positively correlated with shoot allocation, while when varied by
changing light availability across a given N regime, it bore no clear relationship to allocation (Fig. 7.3A). In the former case, N limitation elicited both
a reduction in shoot N (and hence photosynthetic capacity) and in shoot
growth relative to root growth, consistent with recent models of optimal
shoot/root partitioning (Agren and Ingestad 1987; Levin et al. 1989; Hilbert
1990). Under low light, however, photosynthesis is limited by light energy
rather than N, and thus an increase in root allocation (i.e., decreased shoot
fraction) is not beneficial.
Shoot/root allocation was more clearly related to the activity of the root
system in radish than was photosynthesis (Fig. 7.3B). Over all treatments a
curvilinear relationship was seen between the mean N03 - uptake rate
per unit root mass and shoot allocation, with fractional shoot allocation
saturating at high root activities. Although uptake rate and allocation were
strongly and nearly linearly related at lower uptake rates, there was a broad
range of higher uptake rates over which allocation showed little variation. In
K. Fichtner et al.
Table 7.1. Relative growth rate, allocation, and photosynthesis of wild radish (Raphanus
sativus x raphanistrum) grown at different light and N03 - availabilities in solution
culture (means ± SE, see Koch et al. 1987 and Kiippers et al. 1988 for details). Daily
quantum fluxes of 35.3, 25.2, 14.1, and 8.6molm:- 2 d- 1 were provided at photoperiod 1
PFD (h/llmol m- 2 S-I) combinations of 14/700, 10/700, 14/280, and 61400, respectively.
N0 3 - treatments designated by an "X" used relative addition of N03 - at different
fractions of the projec.ted optimal N demand ([N03 -] generally below 5 mmolm- 3 ). At a
daily quantum flux of 25.2 mol m- 2 d-l, photosynthesis per unit leaf area was estimated
from the mean specific leaf area and the photosynthesis-leaf [N] relationship determined
from the 5 and 100mmolm- 3 N0 3 - treatments: photosynthesis (nmolg- 1 s-l) = 12.89·
N(mgg-l) - 15.6, (r2 = 0.85, p < 0.01, Koch, unpublished data). Ambient photosynthesis was measured on three to five plants in all other treatments. (Kiippers et al. 1988)
Daily
Solution
Relative
Shoot
Whole-plant Whole-shoot
quantum
[N0 3 -]
growth rate
fraction of
organic N
daily
flux
mmolm- 3 gg-1 d-1
total dry
mgg- 1
photosynthesis
molm- 2 d- 1
mass
moICm- 2 d- 1
35.3
100
0.358 ± 0.008 0.74 ± 0.03 47.2 ± 2.9
1.01
35.3
10
0.271 ± 0.013 0.70 ± 0.02 34.5 ± 4.5
0.81
25.2
1000
0.302 ± 0.007 0.79 ± 0.01 49.2 ± 0.7
0.90
25.2
100
0.306 ± 0.010 0.79 ± 0.01 48.5 ± 1.1
0.95
25.2
50
0.268 ± 0.008 0.74 ± 0.01
25.2
10
0.247 ± 0.007 0.69 ± 0.01 45.0 ± 0.6
0.76
25.2
5
0.206 ± 0.009 0.64 ± 0.01 31.6 ± 1.6
0.74
25.2
0.5X
0.237 ± 0.012 0.66 ± 0.03 37.3 ± 2.4
0.62
25.2
O.IX
0.172 ± 0.007 0.56 ± 0.02 35.4 ± 2.0
0.56
25.2
O.OIX
0.135 ± 0.008 0.48 ± 0.03 31.1 ± 2.9
0.54
14.1
100
0.237 ± 0.011 0.79 ± 0.02 48.7 ± 1.2
0.45
14.1
10
0.223 ± 0.013 0.72 ± 0.03 39.5 ± 3.4
0.45
8.6
100
0.163 ± 0.005 0.81 ± 0.03 43.9 ± 1.0
0.24
8.6
10
0.145 ± 0.005 0.73 ± 0.03 38.8 ± 1.2
0.26
photosynthesis was varied by changing N availability at a given light level
it was positively correlated with shoot allocation, while when varied by
changing light availability across a given N regime, it bore no clear relationship to allocation (Fig. 7.3A). In the former case, N limitation elicited both
a reduction in shoot N (and hence photosynthetic capacity) and in shoot
growth relative to root growth, consistent with recent models of optimal
shoot/root partitioning (Agren and Ingestad 1987; Levin et al. 1989; Hilbert
1990). Under low light, however, photosynthesis is limited by light energy
rather than N, and thus an increase in root allocation (i.e., decreased shoot
fraction) is not beneficial.
Shoot/root allocation was more clearly related to the activity of the root
system in radish than was photosynthesis (Fig. 7.3B). Over all treatments a
curvilinear relationship was seen between the mean N03 - uptake rate
per unit root mass and shoot allocation, with fractional shoot allocation
saturating at high root activities. Although uptake rate and allocation were
strongly and nearly linearly related at lower uptake rates, there was a broad
range of higher uptake rates over which allocation showed little variation. In