

Apoplastic & Symplastic Proton Concentrations & Their Significance for Metabolism 113
A
:E
<.)
1 4 0 . . - - - - - - - - - - - - - - ,
120
~
100
C
N
o
~
2,
'" Vi
'"
'"
~ o
"0
'" a.
80
60
40
Ficaria
20
10
pH of solution
80
60
40
20
O~-L~~~~~~~~~~~
2
3
4
6
7
8
9
10
pH
B
D
:;:
:E
U
~r-------------,
Buxus
Spongy mesophyll
Palisade parenchyma
go 20
N
o
I
10
o~~-=~~~~~~~~~~
2 3 4 5 6 7 8
10
pH of solution
1 2 0 . . - - - - - - - - - - - - - - ,
Euglena
:E 100
U
go 80
o
I
60
40
20
o~~~~~~~~~~~~
o
2
3
4
6 7 8
pH of solution
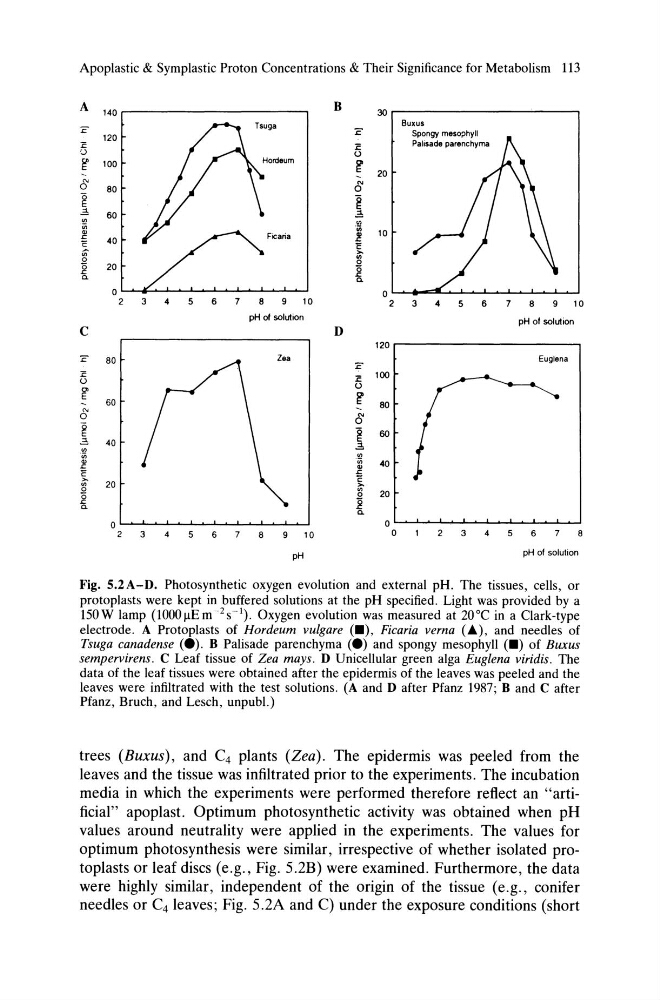
Fig. 5.2 A-D. Photosynthetic oxygen evolution and external pH. The tissues, cells, or
protoplasts were kept in buffered solutions at the pH specified. Light was provided by a
150W lamp (lOOOIlEm-2s-1). Oxygen evolution was measured at 20°C in a Clark-type
electrode. A Protoplasts of Hordeum vulgare (_), Ficaria verna (.A.), and needles of
Tsuga canadense (e). B Palisade parenchyma (e) and spongy mesophyll (_) of Buxus
sempervirens. C Leaf tissue of Zea mays. D Unicellular green alga Euglena viridis. The
data of the leaf tissues were obtained after the epidermis of the leaves was peeled and the
leaves were infiltrated with the test solutions. (A and Dafter Pfanz 1987; Band C after
Pfanz, Bruch, and Lesch, unpub!.)
trees (Buxus), and C4 plants (Zea). The epidermis was peeled from the
leaves and the tissue was infiltrated prior to the experiments. The incubation
media in which the experiments were performed therefore reflect an "artificial" apoplast. Optimum photosynthetic activity was obtained when pH
values around neutrality were applied in the experiments. The values for
optimum photosynthesis were similar, irrespective of whether isolated protoplasts or leaf discs (e.g., Fig. S.2B) were examined. Furthermore, the data
were highly similar, independent of the origin of the tissue (e.g., conifer
needles or C 4 leaves; Fig. S.2A and C) under the exposure conditions (short
A
:E
<.)
1 4 0 . . - - - - - - - - - - - - - - ,
120
~
100
C
N
o
~
2,
'" Vi
'"
'"
~ o
"0
'" a.
80
60
40
Ficaria
20
10
pH of solution
80
60
40
20
O~-L~~~~~~~~~~~
2
3
4
6
7
8
9
10
pH
B
D
:;:
:E
U
~r-------------,
Buxus
Spongy mesophyll
Palisade parenchyma
go 20
N
o
I
10
o~~-=~~~~~~~~~~
2 3 4 5 6 7 8
10
pH of solution
1 2 0 . . - - - - - - - - - - - - - - ,
Euglena
:E 100
U
go 80
o
I
60
40
20
o~~~~~~~~~~~~
o
2
3
4
6 7 8
pH of solution
Fig. 5.2 A-D. Photosynthetic oxygen evolution and external pH. The tissues, cells, or
protoplasts were kept in buffered solutions at the pH specified. Light was provided by a
150W lamp (lOOOIlEm-2s-1). Oxygen evolution was measured at 20°C in a Clark-type
electrode. A Protoplasts of Hordeum vulgare (_), Ficaria verna (.A.), and needles of
Tsuga canadense (e). B Palisade parenchyma (e) and spongy mesophyll (_) of Buxus
sempervirens. C Leaf tissue of Zea mays. D Unicellular green alga Euglena viridis. The
data of the leaf tissues were obtained after the epidermis of the leaves was peeled and the
leaves were infiltrated with the test solutions. (A and Dafter Pfanz 1987; Band C after
Pfanz, Bruch, and Lesch, unpub!.)
trees (Buxus), and C4 plants (Zea). The epidermis was peeled from the
leaves and the tissue was infiltrated prior to the experiments. The incubation
media in which the experiments were performed therefore reflect an "artificial" apoplast. Optimum photosynthetic activity was obtained when pH
values around neutrality were applied in the experiments. The values for
optimum photosynthesis were similar, irrespective of whether isolated protoplasts or leaf discs (e.g., Fig. S.2B) were examined. Furthermore, the data
were highly similar, independent of the origin of the tissue (e.g., conifer
needles or C 4 leaves; Fig. S.2A and C) under the exposure conditions (short