

94
J.S. Amthor
500
:c
.,
C>
8
0' "
400
u
"0
E 300
~
(;
0
200
u
"0 100
E
~
cQ
0 0
0.1
0.2
0.3
0.4
0.5
Relative growth rate (d- 1 )
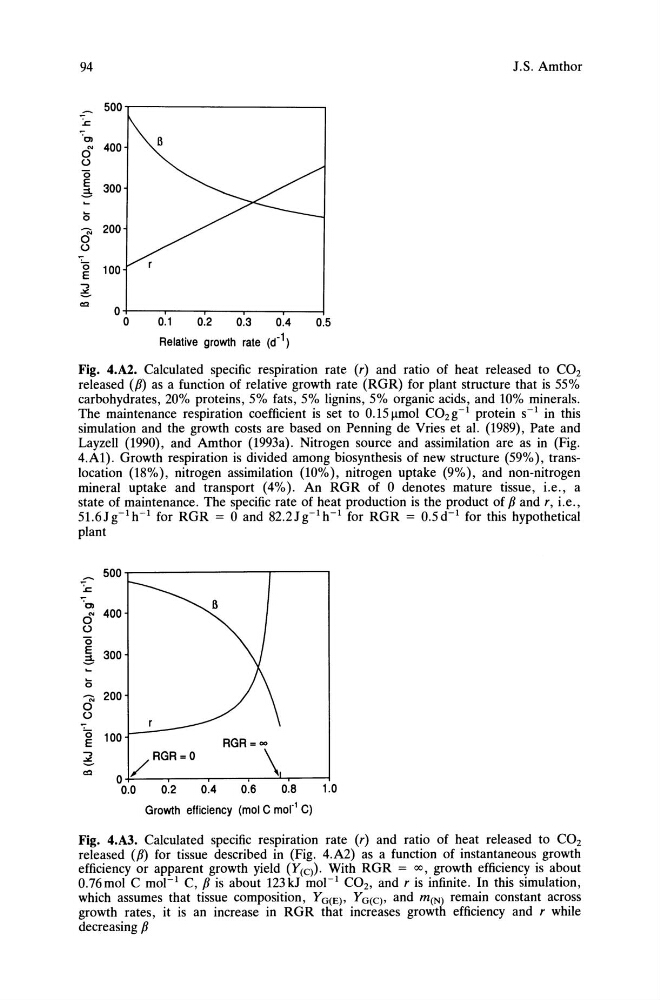
Fig. 4.A2. Calculated specific respiration rate (r) and ratio of heat released to COz
released (p) as a function of relative growth rate (RGR) for plant structure that is 55%
carbohydrates, 20% proteins, 5% fats, 5% Iignins, 5% organic acids, and 10% minerals.
The maintenance respiration coefficient is set to 0.15~mol COzg- 1 protein S-1 in this
simulation and the growth costs are based on Penning de Vries et al. (1989), Pate and
Layzell (1990), and Amthor (1993a). Nitrogen source and assimilation are as in (Fig.
4.A1). Growth respiration is divided among biosynthesis of new structure (59%), translocation (18%), nitrogen assimilation (10%), nitrogen uptake (9%), and non-nitrogen
mineral uptake and transport (4%). An RGR of 0 denotes mature tissue, i.e., a
state of maintenance. The specific rate of heat production is the product of p and r, i.e.,
51.6Jg- 1 h- 1 for RGR = 0 and 82.2Jg- 1 h- 1 for RGR = 0.5d- 1 for this hypothetical
plant
500~--------------.------.
o 400
u
"0
E
~ 300
200
o u
"0 100
E
RGR = 00
/RGR=O
\
O~---.--~----.-~~--~
0.0
0.2
0.4
0.6
0.8
1.0
Growth efficiency (mol C mor l C)
Fig. 4.A3. Calculated specific respiration rate (r) and ratio of heat released to COz
released (p) for tissue described in (Fig. 4.A2) as a function of instantaneous growth
efficiency or apparent growth yield (Y(q). With RGR = 00, growth efficiency is about
0.76mol C mol- 1 C, p is about 123kJ mol- 1 COz, and r is infinite. In this simulation,
which assumes that tissue composition, Y G(E), Y G(C), and m(N) remain constant across
growth rates, it is an increase in RGR that increases growth efficiency and r while
decreasing p
J.S. Amthor
500
:c
.,
C>
8
0' "
400
u
"0
E 300
~
(;
0
200
u
"0 100
E
~
cQ
0 0
0.1
0.2
0.3
0.4
0.5
Relative growth rate (d- 1 )
Fig. 4.A2. Calculated specific respiration rate (r) and ratio of heat released to COz
released (p) as a function of relative growth rate (RGR) for plant structure that is 55%
carbohydrates, 20% proteins, 5% fats, 5% Iignins, 5% organic acids, and 10% minerals.
The maintenance respiration coefficient is set to 0.15~mol COzg- 1 protein S-1 in this
simulation and the growth costs are based on Penning de Vries et al. (1989), Pate and
Layzell (1990), and Amthor (1993a). Nitrogen source and assimilation are as in (Fig.
4.A1). Growth respiration is divided among biosynthesis of new structure (59%), translocation (18%), nitrogen assimilation (10%), nitrogen uptake (9%), and non-nitrogen
mineral uptake and transport (4%). An RGR of 0 denotes mature tissue, i.e., a
state of maintenance. The specific rate of heat production is the product of p and r, i.e.,
51.6Jg- 1 h- 1 for RGR = 0 and 82.2Jg- 1 h- 1 for RGR = 0.5d- 1 for this hypothetical
plant
500~--------------.------.
o 400
u
"0
E
~ 300
200
o u
"0 100
E
RGR = 00
/RGR=O
\
O~---.--~----.-~~--~
0.0
0.2
0.4
0.6
0.8
1.0
Growth efficiency (mol C mor l C)
Fig. 4.A3. Calculated specific respiration rate (r) and ratio of heat released to COz
released (p) for tissue described in (Fig. 4.A2) as a function of instantaneous growth
efficiency or apparent growth yield (Y(q). With RGR = 00, growth efficiency is about
0.76mol C mol- 1 C, p is about 123kJ mol- 1 COz, and r is infinite. In this simulation,
which assumes that tissue composition, Y G(E), Y G(C), and m(N) remain constant across
growth rates, it is an increase in RGR that increases growth efficiency and r while
decreasing p