

Higher Plant Respiration and Its Relationships to Photosynthesis
93
0
1.0
~
0
E
()
0.9
0
§.
0
(5 0.8
>0
' ..., 0.7
3
W
(5
>- 0.6
0.0
0.1
0.2
0.3
0.4
0.5
Protein content (g 9 -1)
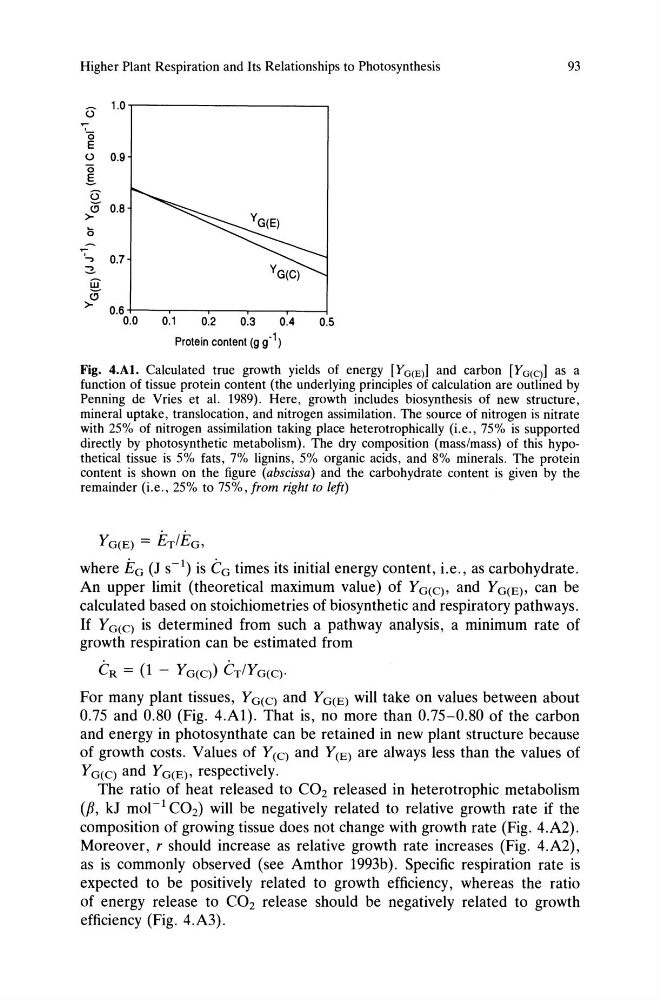
Fig. 4.Al. Calculated true growth yields of energy [Y G(Ell and carbon [Y G(q] as a
function of tissue protein content (the underlying principles of calculation are outlined by
Penning de Vries et al. 1989). Here, growth includes biosynthesis of new structure,
mineral uptake, translocation, and nitrogen assimilation. The source of nitrogen is nitrate
with 25% of nitrogen assimilation taking place heterotrophically (i.e., 75% is supported
directly by photosynthetic metabolism). The dry composition (mass/mass) of this hypothetical tissue is 5% fats, 7% lignins, 5% organic acids, and 8% minerals. The protein
content is shown on the figure (abscissa) and the carbohydrate content is given by the
remainder (i.e., 25% to 75%, from right to left)
YG(E) = ETIEG ,
where EG (J S-l) is C G times its initial energy content, i.e., as carbohydrate.
An upper limit (theoretical maximum value) of Y G(C), and Y G(E), can be
calculated based on stoichiometries of biosynthetic and respiratory pathways.
If Y G(C) is determined from such a pathway analysis, a minimum rate of
growth respiration can be estimated from
CR = (1 - Y G(C)) CTIY G(C)'
For many plant tissues, Y G(C) and Y G(E) will take on values between about
0.75 and 0.80 (Fig. 4.A1). That is, no more than 0.75-0.80 of the carbon
and energy in photosynthate can be retained in new plant structure because
of growth costs. Values of Y(C) and Y(E) are always less than the values of
Y G(C) and Y G(E), respectively.
The ratio of heat released to CO2 released in heterotrophic metabolism
(P, kJ mol- 1 CO2) will be negatively related to relative growth rate if the
composition of growing tissue does not change with growth rate (Fig. 4.A2).
Moreover, r should increase as relative growth rate increases (Fig. 4.A2),
as is commonly observed (see Amthor 1993b). Specific respiration rate is
expected to be positively related to growth efficiency, whereas the ratio
of energy release to CO2 release should be negatively related to growth
efficiency (Fig. 4.A3).
93
0
1.0
~
0
E
()
0.9
0
§.
0
(5 0.8
>0
' ..., 0.7
3
W
(5
>- 0.6
0.0
0.1
0.2
0.3
0.4
0.5
Protein content (g 9 -1)
Fig. 4.Al. Calculated true growth yields of energy [Y G(Ell and carbon [Y G(q] as a
function of tissue protein content (the underlying principles of calculation are outlined by
Penning de Vries et al. 1989). Here, growth includes biosynthesis of new structure,
mineral uptake, translocation, and nitrogen assimilation. The source of nitrogen is nitrate
with 25% of nitrogen assimilation taking place heterotrophically (i.e., 75% is supported
directly by photosynthetic metabolism). The dry composition (mass/mass) of this hypothetical tissue is 5% fats, 7% lignins, 5% organic acids, and 8% minerals. The protein
content is shown on the figure (abscissa) and the carbohydrate content is given by the
remainder (i.e., 25% to 75%, from right to left)
YG(E) = ETIEG ,
where EG (J S-l) is C G times its initial energy content, i.e., as carbohydrate.
An upper limit (theoretical maximum value) of Y G(C), and Y G(E), can be
calculated based on stoichiometries of biosynthetic and respiratory pathways.
If Y G(C) is determined from such a pathway analysis, a minimum rate of
growth respiration can be estimated from
CR = (1 - Y G(C)) CTIY G(C)'
For many plant tissues, Y G(C) and Y G(E) will take on values between about
0.75 and 0.80 (Fig. 4.A1). That is, no more than 0.75-0.80 of the carbon
and energy in photosynthate can be retained in new plant structure because
of growth costs. Values of Y(C) and Y(E) are always less than the values of
Y G(C) and Y G(E), respectively.
The ratio of heat released to CO2 released in heterotrophic metabolism
(P, kJ mol- 1 CO2) will be negatively related to relative growth rate if the
composition of growing tissue does not change with growth rate (Fig. 4.A2).
Moreover, r should increase as relative growth rate increases (Fig. 4.A2),
as is commonly observed (see Amthor 1993b). Specific respiration rate is
expected to be positively related to growth efficiency, whereas the ratio
of energy release to CO2 release should be negatively related to growth
efficiency (Fig. 4.A3).