

Chapter 2 . Unsupervised Artificial Neural Networks
25
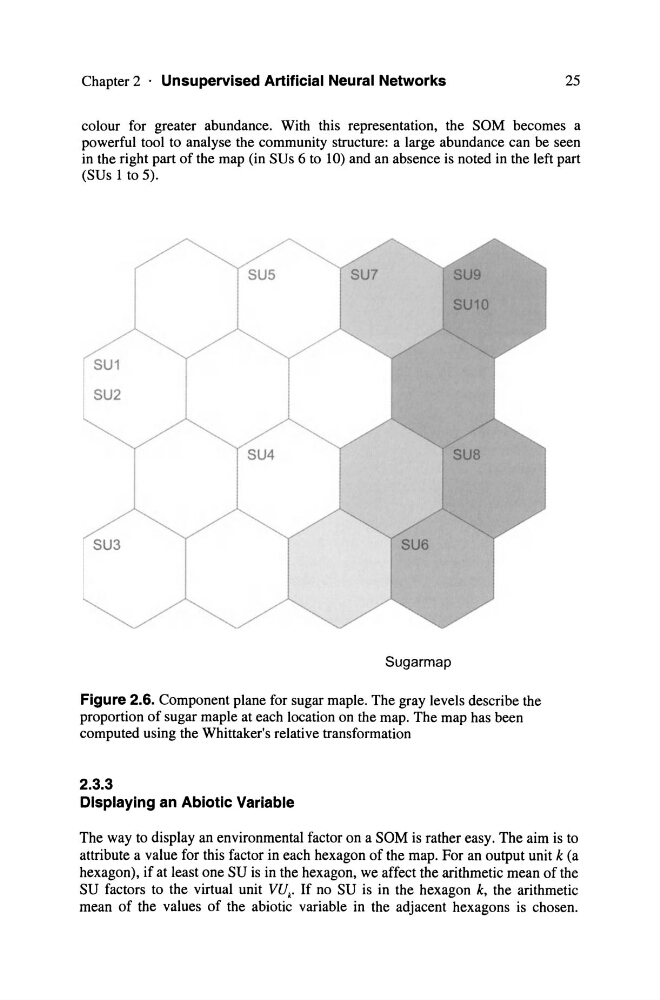
colour for greater abundance. With this representation, the SOM becomes a
powerful tool to analyse the community structure: a large abundance can be seen
in the right part of the map (in SUs 6 to 10) and an absence is noted in the left part
(SUs 1 to 5).
SU1
SU2
SU3
Sugarmap
Figure 2.6. Component plane for sugar maple. The gray levels describe the
proportion of sugar maple at each location on the map. The map has been
computed using the Whittaker's relative transformation
2.3.3
Displaying an Abiotic Variable
The way to display an environmental factor on a SOM is rather easy. The aim is to
attribute a value for this factor in each hexagon of the map. For an output unit k (a
hexagon), if at least one SU is in the hexagon, we affect the arithmetic mean of the
SU factors to the virtual unit VU k • If no SU is in the hexagon k, the arithmetic
mean of the values of the abiotic variable in the adjacent hexagons is chosen.
25
colour for greater abundance. With this representation, the SOM becomes a
powerful tool to analyse the community structure: a large abundance can be seen
in the right part of the map (in SUs 6 to 10) and an absence is noted in the left part
(SUs 1 to 5).
SU1
SU2
SU3
Sugarmap
Figure 2.6. Component plane for sugar maple. The gray levels describe the
proportion of sugar maple at each location on the map. The map has been
computed using the Whittaker's relative transformation
2.3.3
Displaying an Abiotic Variable
The way to display an environmental factor on a SOM is rather easy. The aim is to
attribute a value for this factor in each hexagon of the map. For an output unit k (a
hexagon), if at least one SU is in the hexagon, we affect the arithmetic mean of the
SU factors to the virtual unit VU k • If no SU is in the hexagon k, the arithmetic
mean of the values of the abiotic variable in the adjacent hexagons is chosen.