

Chapter 19 . Age Estimation of Marine Fish
373
Punt el al. (2001). The sampies used in this study do not come from known-age
fish, but the ages were estimated by experienced readers with many years of
experience with each of the species.
Images of the otolith sections were saved as eight bit greyscale tagged image
format files. From each of the images, luminance data were collected from up to
five transects for all species (the signal data). The transects lines were marked
with the cursor on the images from the primordium of the otolith to the edge of the
otolith. The transects were marked on the areas of the otolith which showed a
clear alternating patterns of opaque and translucent zones that would be used by
an experienced reader when estimating age. The location and number of transects
varied among species but were consistent for all individuals within species
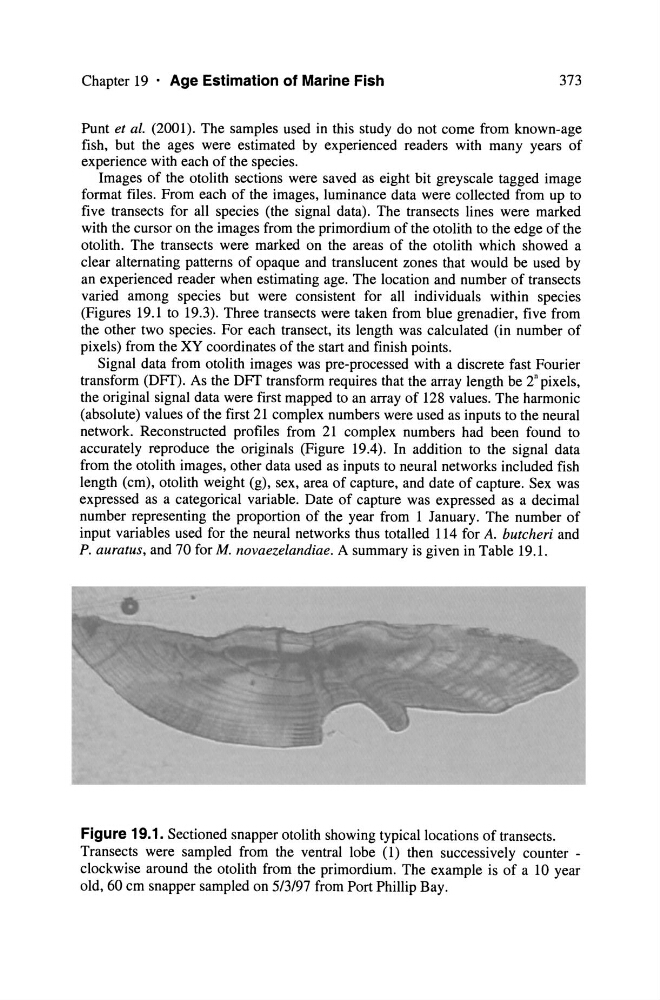
(Figures 19.1 to 19.3). Three transects were taken from blue grenadier, five from
the other two species. For each transect, its length was calculated (in number of
pixels) from the XY coordinates of the start and finish points.
Signal data from otolith images was pre-processed with a discrete fast Fourier
transform (DFT). As the DFT transform requires that the array length be 2" pixels,
the original signal data were first mapped to an array of 128 values. The harmonie
(absolute) values of the first 21 complex numbers were used as inputs to the neural
network. Reconstructed profiles from 21 complex numbers had been found to
accurately reproduce the originals (Figure 19.4). In addition to the signal data
from the otolith images, other data used as inputs to neural networks included fish
length (ern), otolith weight (g), sex, area of capture, and date of capture. Sex was
expressed as a categorical variable. Date of capture was expressed as a decimal
number representing the proportion of the year from 1 January. The number of
input variables used for the neural networks thus totalled 114 for A. butcheri and
P. auralus, and 70 for M. novaezelandiae. A summary is given in Table 19.1.
Figure 19.1. Sectioned snapper otolith showing typicallocations of transects.
Transects were sampled from the ventral lobe (1) then successively counter -
clockwise around the otolith from the primordium. The example is of a 10 year
old, 60 cm snapper sampled on 5/3/97 from Port Phillip Bay.
373
Punt el al. (2001). The sampies used in this study do not come from known-age
fish, but the ages were estimated by experienced readers with many years of
experience with each of the species.
Images of the otolith sections were saved as eight bit greyscale tagged image
format files. From each of the images, luminance data were collected from up to
five transects for all species (the signal data). The transects lines were marked
with the cursor on the images from the primordium of the otolith to the edge of the
otolith. The transects were marked on the areas of the otolith which showed a
clear alternating patterns of opaque and translucent zones that would be used by
an experienced reader when estimating age. The location and number of transects
varied among species but were consistent for all individuals within species
(Figures 19.1 to 19.3). Three transects were taken from blue grenadier, five from
the other two species. For each transect, its length was calculated (in number of
pixels) from the XY coordinates of the start and finish points.
Signal data from otolith images was pre-processed with a discrete fast Fourier
transform (DFT). As the DFT transform requires that the array length be 2" pixels,
the original signal data were first mapped to an array of 128 values. The harmonie
(absolute) values of the first 21 complex numbers were used as inputs to the neural
network. Reconstructed profiles from 21 complex numbers had been found to
accurately reproduce the originals (Figure 19.4). In addition to the signal data
from the otolith images, other data used as inputs to neural networks included fish
length (ern), otolith weight (g), sex, area of capture, and date of capture. Sex was
expressed as a categorical variable. Date of capture was expressed as a decimal
number representing the proportion of the year from 1 January. The number of
input variables used for the neural networks thus totalled 114 for A. butcheri and
P. auralus, and 70 for M. novaezelandiae. A summary is given in Table 19.1.
Figure 19.1. Sectioned snapper otolith showing typicallocations of transects.
Transects were sampled from the ventral lobe (1) then successively counter -
clockwise around the otolith from the primordium. The example is of a 10 year
old, 60 cm snapper sampled on 5/3/97 from Port Phillip Bay.