

362
18.2.5
M.F. Wilkins' L. Boddy . G.BJ. Dubelaar
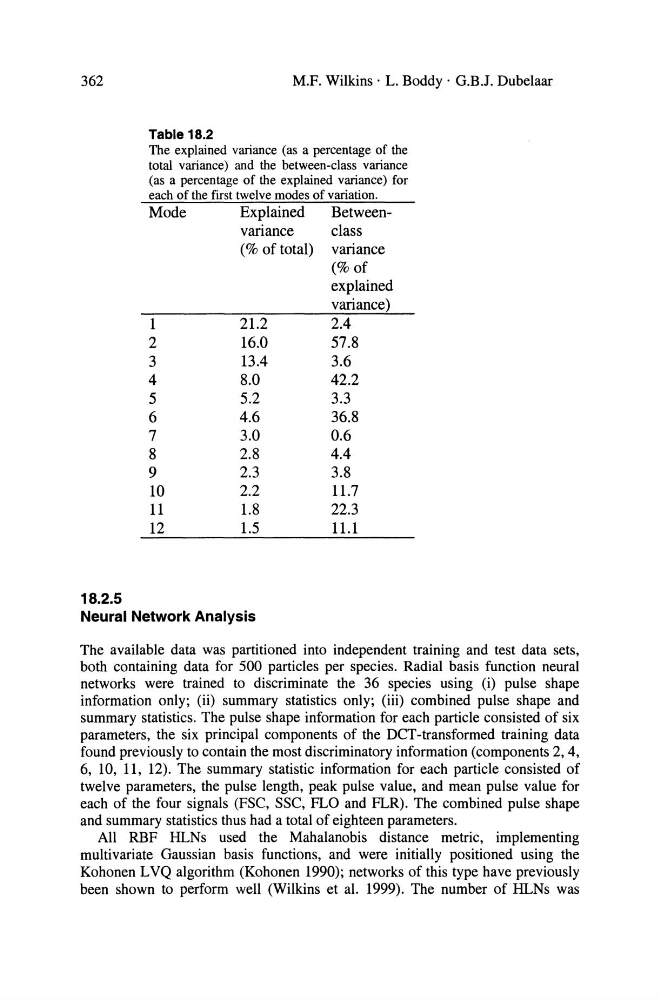
Table 18.2
The explained variance (as a percentage of the
total variance) and the between-class variance
(as a percentage of the explained variance) for
each of the first twelve modes of variation.
Mode
Explained
Between1
2
3
4
5
6
7
8
9
10
11
12
variance
(% of total)
21.2
16.0
13.4
8.0
5.2
4.6
3.0
2.8
2.3
2.2
1.8
1.5
c1ass
variance
(% of
explained
variance)
2.4
57.8
3.6
42.2
3.3
36.8
0.6
4.4
3.8
11.7
22.3
11.1
Neural Network Analysis
The available data was partitioned into independent training and test data sets,
both containing data for 500 particles per species. Radial basis function neural
networks were trained to discriminate the 36 species using (i) pulse shape
information only; (ii) summary statistics only; (iii) combined pulse shape and
summary statistics. The pulse shape information for each particle consisted of six
parameters, the six principal components of the DCT -transformed training data
found previously to contain the most discriminatory information (components 2, 4,
6, 10, 11, 12). The summary statistic information for each particle consisted of
twelve parameters, the pulse length, peak pulse value, and mean pulse value for
each of the four signals (FSC, SSC, FLO and FLR). The combined pulse shape
and summary statistics thus had a total of eighteen parameters.
All RBF HLNs used the Mahalanobis distance metric, implementing
multivariate Gaussian basis functions, and were initially positioned using the
Kohonen L VQ algorithm (Kohonen 1990); networks of this type have previously
been shown to perform wen (Wilkins et al. 1999). The number of HLNs was
18.2.5
M.F. Wilkins' L. Boddy . G.BJ. Dubelaar
Table 18.2
The explained variance (as a percentage of the
total variance) and the between-class variance
(as a percentage of the explained variance) for
each of the first twelve modes of variation.
Mode
Explained
Between1
2
3
4
5
6
7
8
9
10
11
12
variance
(% of total)
21.2
16.0
13.4
8.0
5.2
4.6
3.0
2.8
2.3
2.2
1.8
1.5
c1ass
variance
(% of
explained
variance)
2.4
57.8
3.6
42.2
3.3
36.8
0.6
4.4
3.8
11.7
22.3
11.1
Neural Network Analysis
The available data was partitioned into independent training and test data sets,
both containing data for 500 particles per species. Radial basis function neural
networks were trained to discriminate the 36 species using (i) pulse shape
information only; (ii) summary statistics only; (iii) combined pulse shape and
summary statistics. The pulse shape information for each particle consisted of six
parameters, the six principal components of the DCT -transformed training data
found previously to contain the most discriminatory information (components 2, 4,
6, 10, 11, 12). The summary statistic information for each particle consisted of
twelve parameters, the pulse length, peak pulse value, and mean pulse value for
each of the four signals (FSC, SSC, FLO and FLR). The combined pulse shape
and summary statistics thus had a total of eighteen parameters.
All RBF HLNs used the Mahalanobis distance metric, implementing
multivariate Gaussian basis functions, and were initially positioned using the
Kohonen L VQ algorithm (Kohonen 1990); networks of this type have previously
been shown to perform wen (Wilkins et al. 1999). The number of HLNs was