

Chapter 18 . Identification of Marine Microalgae
FSC
SSC
FLO
FLR
Mode
1
2
3
~ . ' : ' ' ' ' ' ' ' ' ' ' '
.'"
..... = - - - - -
361
4
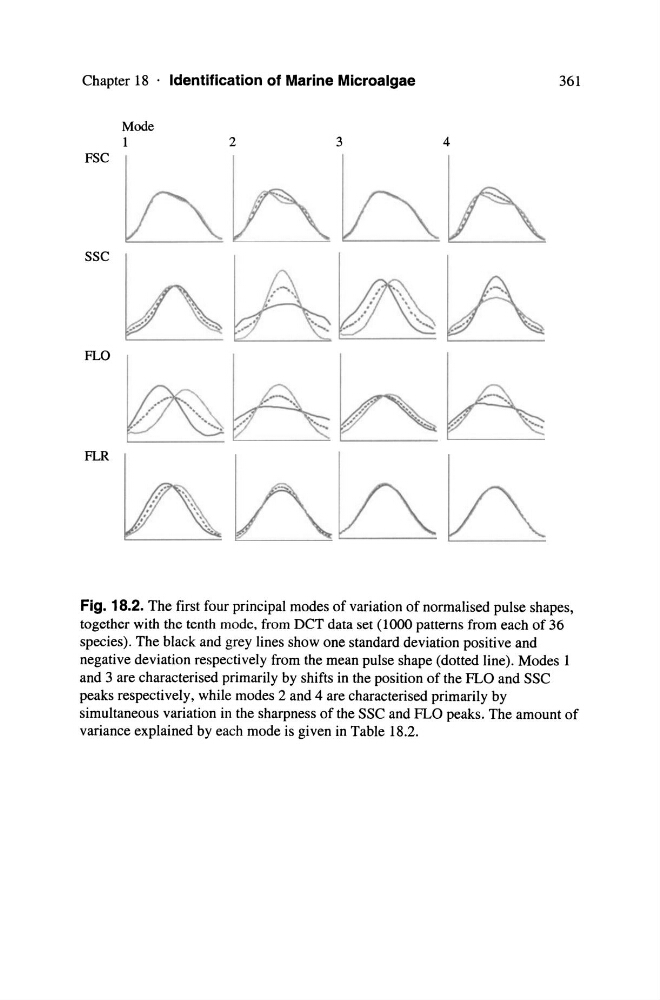
Fig. 18.2. The first four principal modes of variation of normalised pulse shapes,
together with the tenth mode, from DCT data set (1000 patterns from each of 36
species). The black and grey lines show one standard deviation positive and
negative deviation respectively from the mean pulse shape (dotted line). Modes 1
and 3 are characterised primarily by shifts in the position of the FLO and SSC
peaks respectively, while modes 2 and 4 are characterised primarily by
simultaneous variation in the sharpness of the SSC and FLO peaks. The amount of
variance explained by each mode is given in Table 18.2.
FSC
SSC
FLO
FLR
Mode
1
2
3
~ . ' : ' ' ' ' ' ' ' ' ' ' '
.'"
..... = - - - - -
361
4
Fig. 18.2. The first four principal modes of variation of normalised pulse shapes,
together with the tenth mode, from DCT data set (1000 patterns from each of 36
species). The black and grey lines show one standard deviation positive and
negative deviation respectively from the mean pulse shape (dotted line). Modes 1
and 3 are characterised primarily by shifts in the position of the FLO and SSC
peaks respectively, while modes 2 and 4 are characterised primarily by
simultaneous variation in the sharpness of the SSC and FLO peaks. The amount of
variance explained by each mode is given in Table 18.2.