

342
D.G. Chen
17.4.1.2
Fuzzy-SR Model Analysis
To implement the Fuzzy-SR model, the input data SST for the fuzzy operation is
re-scaled from 0 to 1. The fuzzy membership function is iIIustrated in Figure
17.2a corresponding to the re-scaled data. This FMF in Fig. 17.2a is also
standardized to the range 0 to 1 with FMFwarm(O, a, ß)=O and with FMFwarm(l, a,
ß)= 1. Following the Fuzzy-SR model described in Section (17.2.2), the fuzzy
parameters (a J • a 2 • b J and b 2 ) and FMF
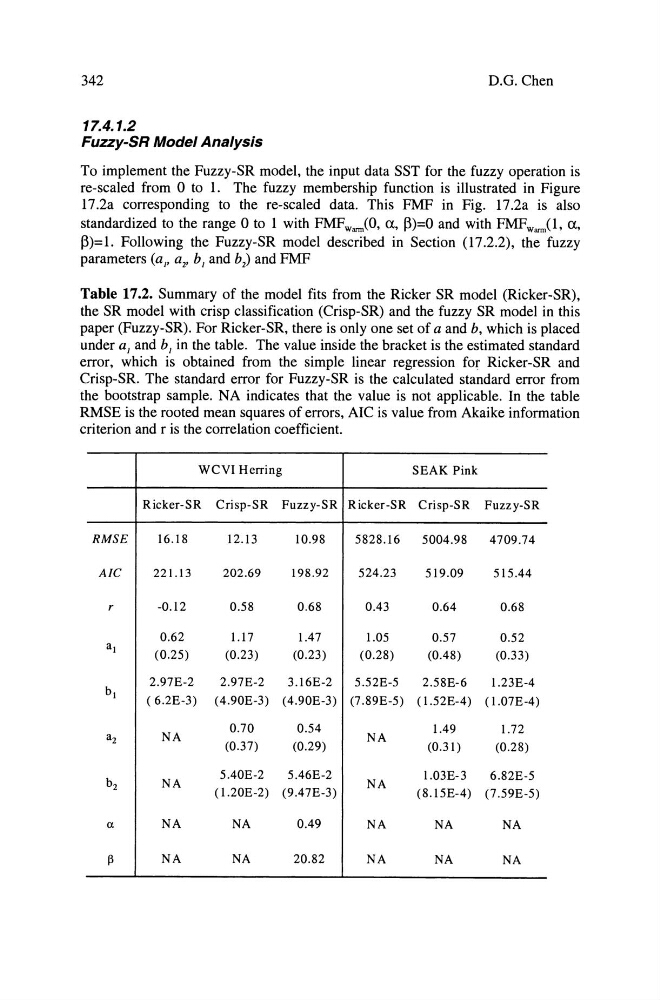
Table 17.2. Summary of the model fits from the Ricker SR model (Ricker-SR),
the SR model with crisp c1assification (Crisp-SR) and the fuzzy SR model in this
paper (Fuzzy-SR). For Ricker-SR, there is only one set of a and b, which is placed
under a J and b J in the table. The value inside the bracket is the estimated standard
error, which is obtained from the simple linear regression for Ricker-SR and
Crisp-SR. The standard error for Fuzzy-SR is the calculated standard error from
the bootstrap sampie. NA indicates that the value is not applicable. In the table
RMSE is the rooted mean squares of errors, AIC is value from Akaike information
criterion and r is the correlation coefficient.
WCVI Herring
SEAK Pink
Ricker-SR Crisp-SR Fuzzy-SR Ricker-SR Crisp-SR Fuzzy-SR
RMSE
16.18
12.13
10.98
5828.16
5004.98
4709.74
Ale
221.13
202.69
198.92
524.23
519.09
515.44
r
-0.12
0.58
0.68
0.43
0.64
0.68
0.62
1.17
1.47
1.05
0.57
0.52
a1
(0.25)
(0.23)
(0.23)
(0.28)
(0.48)
(0.33 )
2.97E-2
2.97E-2
3.16E-2
5.52E-5
2.58E-6
1.23E-4
b 1
( 6.2E-3) ( 4.90E-3) ( 4.90E-3) (7.89E-5) ( l.52E-4) (l.07E-4)
0.70
0.54
1.49
1.72
a2
NA
NA
(0.37)
(0.29)
(0.31 )
(0.28)
b 2
5.40E-2
5.46E-2
1.03E-3
6.82E-5
NA
(9.47E-3)
NA
( 1.20E-2)
(8.15E-4) (7.59E-5)
(J.
NA
NA
0.49
NA
NA
NA
ß
NA
NA
20.82
NA
NA
NA
D.G. Chen
17.4.1.2
Fuzzy-SR Model Analysis
To implement the Fuzzy-SR model, the input data SST for the fuzzy operation is
re-scaled from 0 to 1. The fuzzy membership function is iIIustrated in Figure
17.2a corresponding to the re-scaled data. This FMF in Fig. 17.2a is also
standardized to the range 0 to 1 with FMFwarm(O, a, ß)=O and with FMFwarm(l, a,
ß)= 1. Following the Fuzzy-SR model described in Section (17.2.2), the fuzzy
parameters (a J • a 2 • b J and b 2 ) and FMF
Table 17.2. Summary of the model fits from the Ricker SR model (Ricker-SR),
the SR model with crisp c1assification (Crisp-SR) and the fuzzy SR model in this
paper (Fuzzy-SR). For Ricker-SR, there is only one set of a and b, which is placed
under a J and b J in the table. The value inside the bracket is the estimated standard
error, which is obtained from the simple linear regression for Ricker-SR and
Crisp-SR. The standard error for Fuzzy-SR is the calculated standard error from
the bootstrap sampie. NA indicates that the value is not applicable. In the table
RMSE is the rooted mean squares of errors, AIC is value from Akaike information
criterion and r is the correlation coefficient.
WCVI Herring
SEAK Pink
Ricker-SR Crisp-SR Fuzzy-SR Ricker-SR Crisp-SR Fuzzy-SR
RMSE
16.18
12.13
10.98
5828.16
5004.98
4709.74
Ale
221.13
202.69
198.92
524.23
519.09
515.44
r
-0.12
0.58
0.68
0.43
0.64
0.68
0.62
1.17
1.47
1.05
0.57
0.52
a1
(0.25)
(0.23)
(0.23)
(0.28)
(0.48)
(0.33 )
2.97E-2
2.97E-2
3.16E-2
5.52E-5
2.58E-6
1.23E-4
b 1
( 6.2E-3) ( 4.90E-3) ( 4.90E-3) (7.89E-5) ( l.52E-4) (l.07E-4)
0.70
0.54
1.49
1.72
a2
NA
NA
(0.37)
(0.29)
(0.31 )
(0.28)
b 2
5.40E-2
5.46E-2
1.03E-3
6.82E-5
NA
(9.47E-3)
NA
( 1.20E-2)
(8.15E-4) (7.59E-5)
(J.
NA
NA
0.49
NA
NA
NA
ß
NA
NA
20.82
NA
NA
NA