

Chapter 17· Classification of Fish Stock-Recruitment Relationships 341
This negative correlation between the SST and the biomass of WCVI herring
recruits has been a consistent feature of the recruitment time series, since Tester
(1948) discovered it about 50-years ago. Recent work indicates that the
relationship between parent spawners and recruits is masked by the temperature
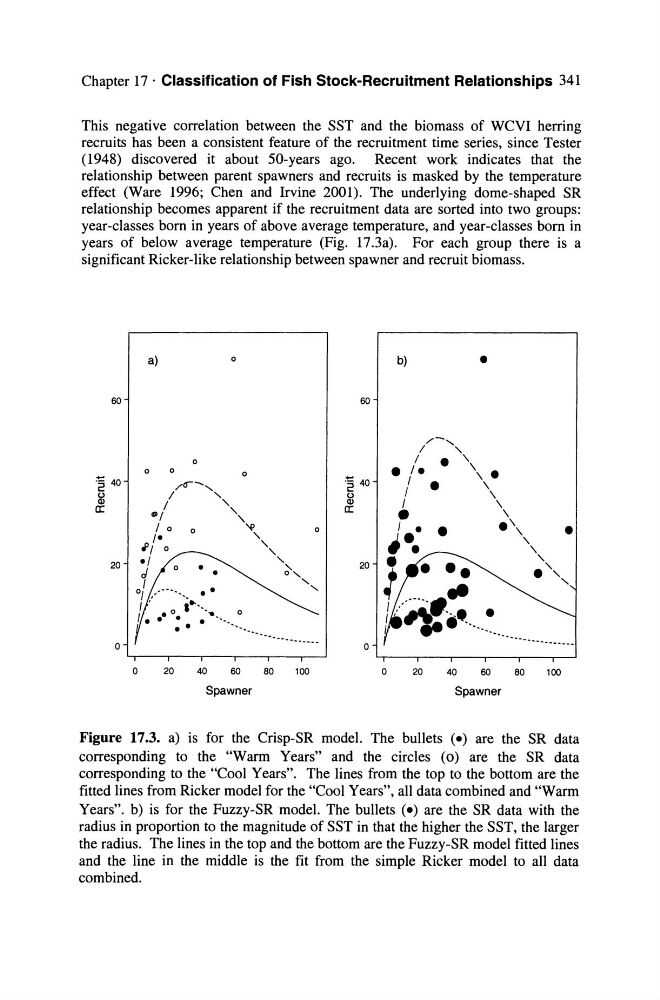
effect (Ware 1996; Chen and Irvine 2001). The underlying dome-shaped SR
relationship becomes apparent if the recruitment data are sorted into two groups:
year-classes born in years of above average temperature, and year-classes born in
years of below average temperature (Fig. 17.3a). For each group there is a
significant Ricker-like relationship between spawner and recruit biomass .
a)
o
b)
•
60
60
,...-,
I
,
o
o
o
0
/
."
• le
\ •
I .
\
I
\
I
\
20
o
•
. \
I e. .\
..1..
\
. . \
. "
20 :
•.• ~ : :
• " ,
1/-,..····. •
I
p • ...........
-------------- ..
o
o
20
40
60
80
100
o
20
40
60
80
100
Spawner
Spawner
Figure 17.3. a) is for the Crisp-SR model. The bullets (e) are the SR data
corresponding to the "WarmY ears" and the circles ( 0) are the SR data
corresponding to the "Cool Years". The lines from the top to the bottom are the
fitted lines from Ricker model for the "Cool Years", all data combined and "Warm
Years". b) is for the Fuzzy-SR model. The bullets (e) are the SR data with the
radius in proportion to the magnitude of SST in that the higher the SST, the larger
the radius. The lines in the top and the bottom are the Fuzzy-SR model fitted lines
and the line in the middle is the fit from the simple Ricker model to all data
combined.
This negative correlation between the SST and the biomass of WCVI herring
recruits has been a consistent feature of the recruitment time series, since Tester
(1948) discovered it about 50-years ago. Recent work indicates that the
relationship between parent spawners and recruits is masked by the temperature
effect (Ware 1996; Chen and Irvine 2001). The underlying dome-shaped SR
relationship becomes apparent if the recruitment data are sorted into two groups:
year-classes born in years of above average temperature, and year-classes born in
years of below average temperature (Fig. 17.3a). For each group there is a
significant Ricker-like relationship between spawner and recruit biomass .
a)
o
b)
•
60
60
,...-,
I
,
o
o
o
0
/
."
• le
\ •
I .
\
I
\
I
\
20
o
•
. \
I e. .\
..1..
\
. . \
. "
20 :
•.• ~ : :
• " ,
1/-,..····. •
I
p • ...........
-------------- ..
o
o
20
40
60
80
100
o
20
40
60
80
100
Spawner
Spawner
Figure 17.3. a) is for the Crisp-SR model. The bullets (e) are the SR data
corresponding to the "WarmY ears" and the circles ( 0) are the SR data
corresponding to the "Cool Years". The lines from the top to the bottom are the
fitted lines from Ricker model for the "Cool Years", all data combined and "Warm
Years". b) is for the Fuzzy-SR model. The bullets (e) are the SR data with the
radius in proportion to the magnitude of SST in that the higher the SST, the larger
the radius. The lines in the top and the bottom are the Fuzzy-SR model fitted lines
and the line in the middle is the fit from the simple Ricker model to all data
combined.