

Chapter 15 . Evolved Predictive Rules for Algal Dynamics
305
The sensitivity of the model was defined as the ratio of true positive predictions
(TPPs) to actual measured positive results, and similarly for specijicity. Both
sensitivity and specificity measure the error rates of the model on positive and
negative outcomes respectively. A third measure that appeared to be useful was
the positive predictive power of the model. This is defined as the ratio of true
positive results to predicted positive results, and represents a measure of the
confidence we can have in a positive outcome of the model. The error rate is the
ratio of true predictions to examples presented, whether positive or negative.
Evolution is a stochastic optimization procedure which produces different
results in each trial. It is therefore necessary to conduct independent trials in order
to evaluate the algorithms performance. 100 independent trials were conducted for
each of the datasets. The error rate, sensitivity, specijicity and positive predictive
power were calculated for each run and the distribution of the error measures over
the 100 runs were graphed.
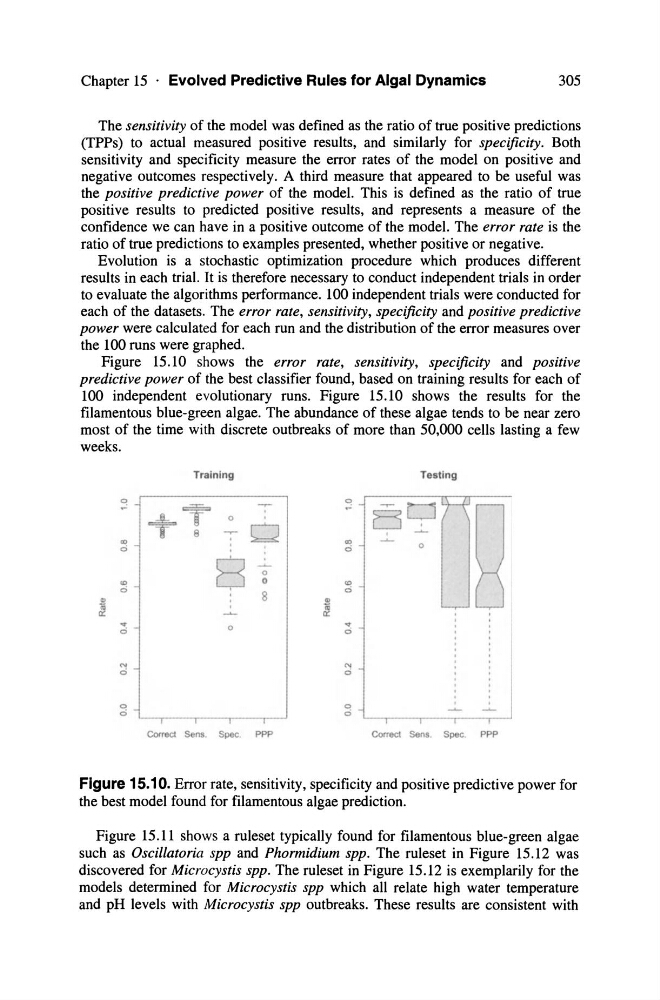
Figure 15.10 shows the error rate, sensitivity, specijicity and positive
predictive power of the best classifier found, based on training results for each of
100 independent evolutionary runs. Figure 15.10 shows the results for the
filamentous blue-green algae. The abundance of these algae tends to be near zero
most of the time with discrete outbreaks of more than 50,000 cells lasting a few
weeks.
Training
Testing
C!
+T
-.C!
-'-0
.
0
ES . . . : . . .
~
a
,
<0
<0
~
ci
ci
0
8
0
'"
0
ci
'"
8
.!!
~
~
. .
0
...
ci
ci
<"!
<"!
0
0
0
0
~
ci
ci
Co
Figure 15.10. Error rate, sensitivity, specificity and positive predictive power for
the best model found for filamentous algae prediction.
Figure 15.11 shows a ruleset typically found for filamentous blue-green algae
such as Oscillatoria spp and Phormidium spp. The ruleset in Figure 15.12 was
discovered for Microcystis spp. The ruleset in Figure 15.12 is exemplarily for the
models determined for Microcystis spp which all relate high water temperature
and pR levels with Microcystis spp outbreaks. These results are consistent with
305
The sensitivity of the model was defined as the ratio of true positive predictions
(TPPs) to actual measured positive results, and similarly for specijicity. Both
sensitivity and specificity measure the error rates of the model on positive and
negative outcomes respectively. A third measure that appeared to be useful was
the positive predictive power of the model. This is defined as the ratio of true
positive results to predicted positive results, and represents a measure of the
confidence we can have in a positive outcome of the model. The error rate is the
ratio of true predictions to examples presented, whether positive or negative.
Evolution is a stochastic optimization procedure which produces different
results in each trial. It is therefore necessary to conduct independent trials in order
to evaluate the algorithms performance. 100 independent trials were conducted for
each of the datasets. The error rate, sensitivity, specijicity and positive predictive
power were calculated for each run and the distribution of the error measures over
the 100 runs were graphed.
Figure 15.10 shows the error rate, sensitivity, specijicity and positive
predictive power of the best classifier found, based on training results for each of
100 independent evolutionary runs. Figure 15.10 shows the results for the
filamentous blue-green algae. The abundance of these algae tends to be near zero
most of the time with discrete outbreaks of more than 50,000 cells lasting a few
weeks.
Training
Testing
C!
+T
-.C!
-'-0
.
0
ES . . . : . . .
~
a
,
<0
<0
~
ci
ci
0
8
0
'"
0
ci
'"
8
.!!
~
~
. .
0
...
ci
ci
<"!
<"!
0
0
0
0
~
ci
ci
Co
Figure 15.10. Error rate, sensitivity, specificity and positive predictive power for
the best model found for filamentous algae prediction.
Figure 15.11 shows a ruleset typically found for filamentous blue-green algae
such as Oscillatoria spp and Phormidium spp. The ruleset in Figure 15.12 was
discovered for Microcystis spp. The ruleset in Figure 15.12 is exemplarily for the
models determined for Microcystis spp which all relate high water temperature
and pR levels with Microcystis spp outbreaks. These results are consistent with