

294
J. Bobbin . F. Recknagel
set. This approach presents every generation with a different set of training
patterns, helping to maintain the populations' ability to generalise.
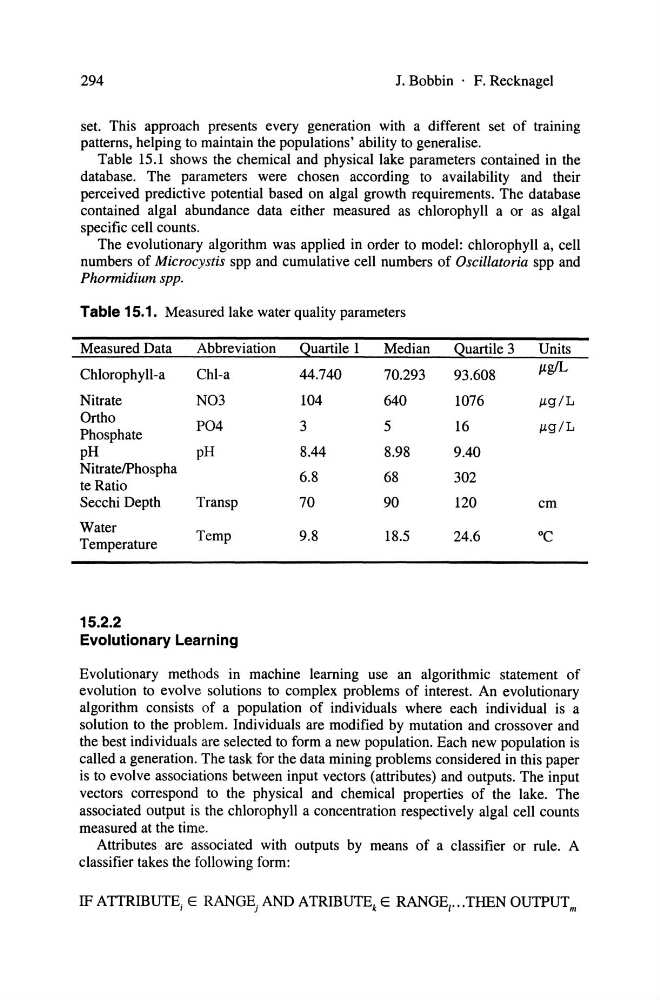
Table 15.1 shows the chemical and physical lake parameters contained in the
database. The parameters were chosen according to availability and their
perceived predictive potential based on algal growth requirements. The database
contained algal abundance data either measured as chlorophyll a or as algal
specific cell counts.
The evolutionary algorithm was applied in order to model: chlorophyll a, cell
numbers of Microcystis spp and cumulative cell numbers of Oscillatoria spp and
Phormidium spp.
Table 15.1. Measured lake water quality parameters
Measured Data
Abbreviation
Quartile 1
Median
Chlorophyll-a
Chl-a
44.740
70.293
Nitrate
N03
104
640
Ortho
P04
3
5
Phosphate
pR
pR
8.44
8.98
Nitrate/Phospha
6.8
68
te Ratio
Secchi Depth
Transp
70
90
Water
Temp
9.8
18.5
Temperature
15.2.2
Evolutionary Learning
Quartile 3
93.608
1076
16
9.40
302
120
24.6
Units
/Lg/L
jJ.g/L
jJ.g/L
cm
Evolutionary methods in machine learning use an algorithmic statement of
evolution to evolve solutions to complex problems of interest. An evolutionary
algorithm consists of a population of individuals where each individual is a
solution to the problem. Individuals are modified by mutation and crossover and
the best individuals are selected to form a new population. Each new population is
called a generation. The task for the data mining problems considered in this paper
is to evolve associations between input vectors (attributes) and outputs. The input
vectors correspond to the physical and chemical properties of the lake. The
associated output is the chlorophyll a concentration respectively algal cell counts
measured at the time.
Attributes are associated with outputs by means of a classifier or rule. A
classifier takes the following form:
IF ATTRIBUTE i E RANGE j AND ATRIBUTE k E RANGE/ ... THEN OUTPUT m
J. Bobbin . F. Recknagel
set. This approach presents every generation with a different set of training
patterns, helping to maintain the populations' ability to generalise.
Table 15.1 shows the chemical and physical lake parameters contained in the
database. The parameters were chosen according to availability and their
perceived predictive potential based on algal growth requirements. The database
contained algal abundance data either measured as chlorophyll a or as algal
specific cell counts.
The evolutionary algorithm was applied in order to model: chlorophyll a, cell
numbers of Microcystis spp and cumulative cell numbers of Oscillatoria spp and
Phormidium spp.
Table 15.1. Measured lake water quality parameters
Measured Data
Abbreviation
Quartile 1
Median
Chlorophyll-a
Chl-a
44.740
70.293
Nitrate
N03
104
640
Ortho
P04
3
5
Phosphate
pR
pR
8.44
8.98
Nitrate/Phospha
6.8
68
te Ratio
Secchi Depth
Transp
70
90
Water
Temp
9.8
18.5
Temperature
15.2.2
Evolutionary Learning
Quartile 3
93.608
1076
16
9.40
302
120
24.6
Units
/Lg/L
jJ.g/L
jJ.g/L
cm
Evolutionary methods in machine learning use an algorithmic statement of
evolution to evolve solutions to complex problems of interest. An evolutionary
algorithm consists of a population of individuals where each individual is a
solution to the problem. Individuals are modified by mutation and crossover and
the best individuals are selected to form a new population. Each new population is
called a generation. The task for the data mining problems considered in this paper
is to evolve associations between input vectors (attributes) and outputs. The input
vectors correspond to the physical and chemical properties of the lake. The
associated output is the chlorophyll a concentration respectively algal cell counts
measured at the time.
Attributes are associated with outputs by means of a classifier or rule. A
classifier takes the following form:
IF ATTRIBUTE i E RANGE j AND ATRIBUTE k E RANGE/ ... THEN OUTPUT m