

186
H. Hoang . F. Recknagel . J. Marshall . S. Choy
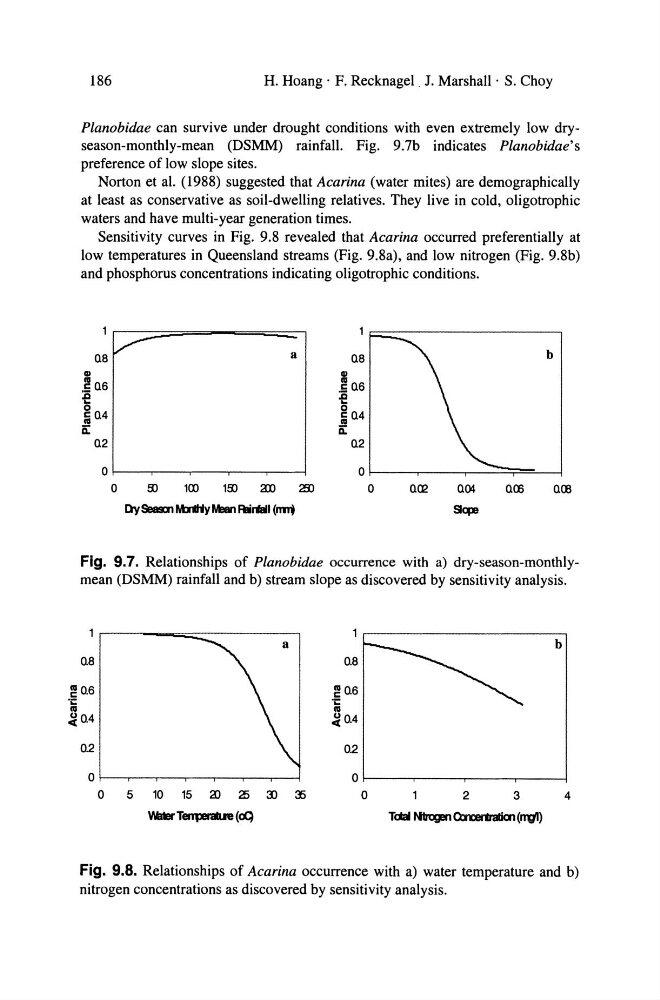
Planobidae can survive under drought conditions with even extremely low dryseason-monthly-mean (DSMM) rainfall. Fig. 9.7b indieates Planobidae's
preference of low slope sites.
Norton et al. (1988) suggested that Acarina (water mites) are demographically
at least as conservative as soil-dwelling relatives. They live in cold, oligotrophie
waters and have multi-year generation times.
Sensitivity curves in Fig. 9.8 revealed that Acarina occurred preferentially at
low temperatures in Queensland streams (Fig. 9.8a), and low nitrogen (Fig. 9.8b)
and phosphorus concentrations indicating oligotrophie conditions.
OB
GI
.~06
.CI
. .
g 04
111
ii:
02
Of----,-----,---,----,---i
0
o
00
100
100
an 2j)
Dy Sea!m MnHy M3an Rirlall (rml
0
0(2
004
SlqE
b
0(l3
000
Fig. 9.7. Relationships of Planobidae occurrence with a) dry-season-monthlymean (DSMM) rainfall and b) stream slope as discovered by sensitivity analysis.
b
08
0.8
~06
~06
.;:
.;:
111
111
~04
~04
02
02
0
0
0
5
10 15 2l 25 :IJ 3)
0
2
3
4
WJEr TerqJeraIue (cQ
Fig. 9.8. Relationships of Acarina occurrence with a) water temperature and b)
nitrogen concentrations as discovered by sensitivity analysis.
H. Hoang . F. Recknagel . J. Marshall . S. Choy
Planobidae can survive under drought conditions with even extremely low dryseason-monthly-mean (DSMM) rainfall. Fig. 9.7b indieates Planobidae's
preference of low slope sites.
Norton et al. (1988) suggested that Acarina (water mites) are demographically
at least as conservative as soil-dwelling relatives. They live in cold, oligotrophie
waters and have multi-year generation times.
Sensitivity curves in Fig. 9.8 revealed that Acarina occurred preferentially at
low temperatures in Queensland streams (Fig. 9.8a), and low nitrogen (Fig. 9.8b)
and phosphorus concentrations indicating oligotrophie conditions.
OB
GI
.~06
.CI
. .
g 04
111
ii:
02
Of----,-----,---,----,---i
0
o
00
100
100
an 2j)
Dy Sea!m MnHy M3an Rirlall (rml
0
0(2
004
SlqE
b
0(l3
000
Fig. 9.7. Relationships of Planobidae occurrence with a) dry-season-monthlymean (DSMM) rainfall and b) stream slope as discovered by sensitivity analysis.
b
08
0.8
~06
~06
.;:
.;:
111
111
~04
~04
02
02
0
0
0
5
10 15 2l 25 :IJ 3)
0
2
3
4
WJEr TerqJeraIue (cQ
Fig. 9.8. Relationships of Acarina occurrence with a) water temperature and b)
nitrogen concentrations as discovered by sensitivity analysis.