

182
H. Hoang . F. Recknagel . J. Marshall . S. Choy
Validation Result.
100
..
I
o Clean WalM Approach lor Refarence Slles
• Dirty Waler Approach lor All Silea
-
- -
1..
110
M..croln'lfllllrtebnlte Tau
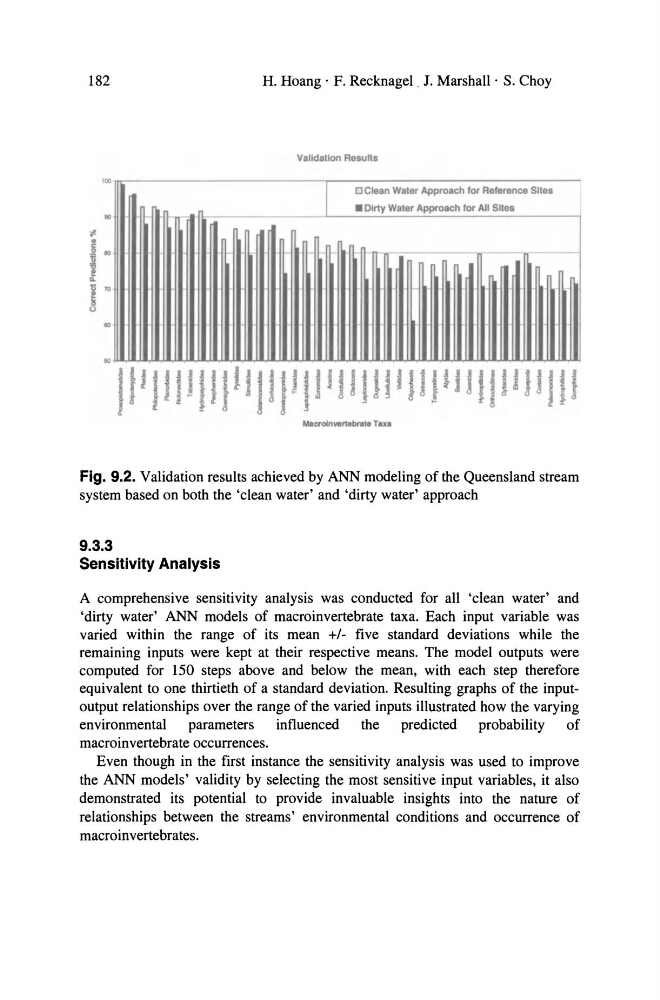
Fig. 9.2. Validation results achieved by ANN modeling of the Queensland stream
system based on both the 'clean water' and 'dirty water' approach
9.3.3
Sensitivity Analysis
A comprehensive sensitivity analysis was conducted for all 'clean water' and
'dirty water' ANN models of macroinvertebrate taxa. Each input variable was
varied within the range of its mean +/- five standard deviations while the
remaining inputs were kept at their respective means. The model outputs were
computed for 150 steps above and below the mean, with each step therefore
equivalent to one thirtieth of a standard deviation. Resulting graphs of the inputoutput relationships over the range of the varied inputs illustrated how the varying
environmental parameters influenced the predicted probability of
macroinvertebrate occurrences.
Even though in the first instance the sensitivity analysis was used to improve
the ANN models' validity by selecting the most sensitive input variables, it also
demonstrated its potential to provide invaluable insights into the nature of
relationships between the streams' environmental conditions and occurrence of
macroinvertebrates.
H. Hoang . F. Recknagel . J. Marshall . S. Choy
Validation Result.
100
..
I
o Clean WalM Approach lor Refarence Slles
• Dirty Waler Approach lor All Silea
-
- -
1..
110
M..croln'lfllllrtebnlte Tau
Fig. 9.2. Validation results achieved by ANN modeling of the Queensland stream
system based on both the 'clean water' and 'dirty water' approach
9.3.3
Sensitivity Analysis
A comprehensive sensitivity analysis was conducted for all 'clean water' and
'dirty water' ANN models of macroinvertebrate taxa. Each input variable was
varied within the range of its mean +/- five standard deviations while the
remaining inputs were kept at their respective means. The model outputs were
computed for 150 steps above and below the mean, with each step therefore
equivalent to one thirtieth of a standard deviation. Resulting graphs of the inputoutput relationships over the range of the varied inputs illustrated how the varying
environmental parameters influenced the predicted probability of
macroinvertebrate occurrences.
Even though in the first instance the sensitivity analysis was used to improve
the ANN models' validity by selecting the most sensitive input variables, it also
demonstrated its potential to provide invaluable insights into the nature of
relationships between the streams' environmental conditions and occurrence of
macroinvertebrates.