

Chapter 8· Analysis of Stream Macroinvertebrate Communities
141
b)
TCL3-9 TCll·ID
TKC3-121HP1-l1
TIIP4-1 TelA·1
THP4-1 TClA-2
TIfP4-1 TeLA-l
3
TIIP4-4 TelA-.
YSC'" 1HP4-5
TCLA- 5 lliP4-1
TelA-7 1HP4-8
TeLA-!
TKCJ.IO veK3-11
YSC3-I! T804·S
YSC4-6 YSC4-S
TSDJ-IOTSD3-11
TSD4-2 tsD4-3 yeX4-' TS04-1 Y103-9 YCK3-9
TKC4-2 TKC4-3
TSD3-12
TSD4-6 TSD4-8 VCK4-2 YCK4-4 YSC3-9 TSDJ-9
TSD4-4 YCK4-5 TKC3-9 YI03-IO
YI04.6 YCK4-6
YCK3.)O YSeJ-IO
yeK4-' TSD4-1 lliP3-iOYI03-11
Y104-8 YeK4-!
YSC3-12 YeX4-3
Y104-1 YSC4-7
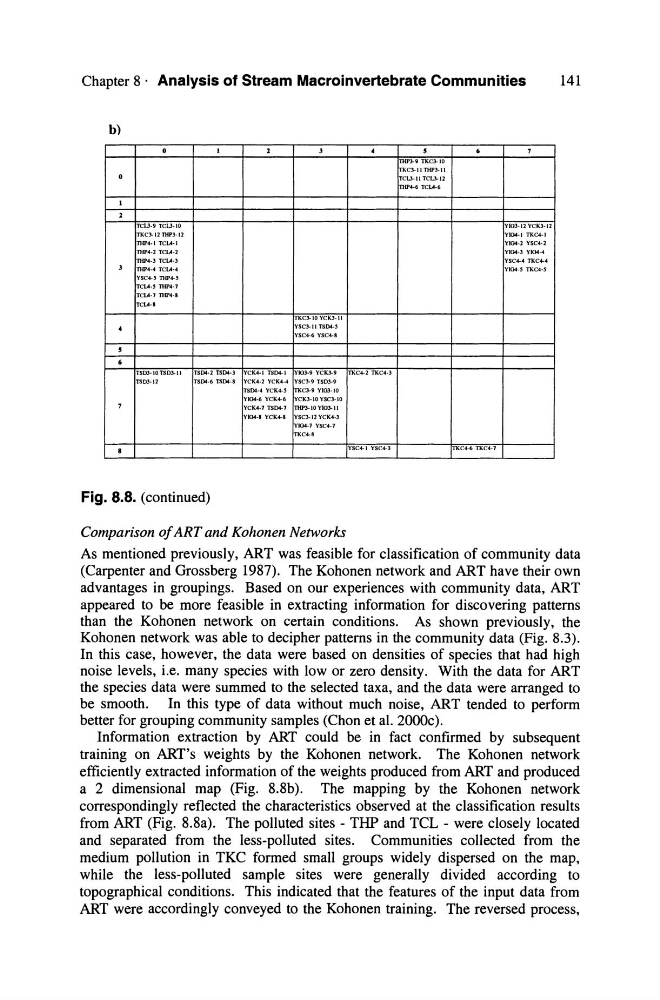
Fig. 8.8. (eontinued)
Comparison 0/ ART and Kohonen Networks
YSC4-1 YSC4-3
lliP3-9 TKC3-IO
TKC:l-11 !HP]-II
leu- 11 leu. 12
llIP4-6 TClA-6
TKC4-6 TKC4-7
YIOJ-12YCK3-12
YI04-1 TKC4-1
YKJ4-2 YSC4-2
YI04-3 YJ044
VSC4-4 TKC4-4
Y104·5 TKC4-S
As mentioned previously, ART was feasible for classifieation of eommunity data
(Carpenter and Grossberg 1987). The Kohonen network and ART have their own
advantages in groupings. Based on our experienees with eommunity data, ART
appeared to be more feasible in extraeting information for diseovering patterns
than the Kohonen network on eertain eonditions. As shown previously, the
Kohonen network was able to deeipher patterns in the eommunity data (Fig. 8.3).
In this ease, however, the data were based on densities of species that had high
noise levels, i.e. many species with low or zero density. With the data for ART
the species data were summed to the seleeted taxa, and the data were arranged to
be smooth. In this type of data without mueh noise, ART tended to perform
better for grouping eommunity sampies (Chon et al. 2000e).
Information extraetion by ART eould be in fact eonfirmed by subsequent
training on ART's weights by the Kohonen network. The Kohonen network
efficiently extraeted information of the weights produeed from ART and produeed
a 2 dimensional map (Fig. 8.8b). The mapping by the Kohonen network
eorrespondingly refleeted the eharaeteristics observed at the classifieation results
from ART (Fig. 8.8a). The polluted sites - THP and TCL - were closely loeated
and separated from the less-polluted sites. Comrnunities eolleeted from the
medium pollution in TKC formed small groups widely dispersed on the map,
while the less-polluted sampie sites were generally divided aeeording to
topographical eonditions. This indieated that the features of the input data from
ART were aeeordingly eonveyed to the Kohonen training. The reversed proeess,
141
b)
TCL3-9 TCll·ID
TKC3-121HP1-l1
TIIP4-1 TelA·1
THP4-1 TClA-2
TIfP4-1 TeLA-l
3
TIIP4-4 TelA-.
YSC'" 1HP4-5
TCLA- 5 lliP4-1
TelA-7 1HP4-8
TeLA-!
TKCJ.IO veK3-11
YSC3-I! T804·S
YSC4-6 YSC4-S
TSDJ-IOTSD3-11
TSD4-2 tsD4-3 yeX4-' TS04-1 Y103-9 YCK3-9
TKC4-2 TKC4-3
TSD3-12
TSD4-6 TSD4-8 VCK4-2 YCK4-4 YSC3-9 TSDJ-9
TSD4-4 YCK4-5 TKC3-9 YI03-IO
YI04.6 YCK4-6
YCK3.)O YSeJ-IO
yeK4-' TSD4-1 lliP3-iOYI03-11
Y104-8 YeK4-!
YSC3-12 YeX4-3
Y104-1 YSC4-7
Fig. 8.8. (eontinued)
Comparison 0/ ART and Kohonen Networks
YSC4-1 YSC4-3
lliP3-9 TKC3-IO
TKC:l-11 !HP]-II
leu- 11 leu. 12
llIP4-6 TClA-6
TKC4-6 TKC4-7
YIOJ-12YCK3-12
YI04-1 TKC4-1
YKJ4-2 YSC4-2
YI04-3 YJ044
VSC4-4 TKC4-4
Y104·5 TKC4-S
As mentioned previously, ART was feasible for classifieation of eommunity data
(Carpenter and Grossberg 1987). The Kohonen network and ART have their own
advantages in groupings. Based on our experienees with eommunity data, ART
appeared to be more feasible in extraeting information for diseovering patterns
than the Kohonen network on eertain eonditions. As shown previously, the
Kohonen network was able to deeipher patterns in the eommunity data (Fig. 8.3).
In this ease, however, the data were based on densities of species that had high
noise levels, i.e. many species with low or zero density. With the data for ART
the species data were summed to the seleeted taxa, and the data were arranged to
be smooth. In this type of data without mueh noise, ART tended to perform
better for grouping eommunity sampies (Chon et al. 2000e).
Information extraetion by ART eould be in fact eonfirmed by subsequent
training on ART's weights by the Kohonen network. The Kohonen network
efficiently extraeted information of the weights produeed from ART and produeed
a 2 dimensional map (Fig. 8.8b). The mapping by the Kohonen network
eorrespondingly refleeted the eharaeteristics observed at the classifieation results
from ART (Fig. 8.8a). The polluted sites - THP and TCL - were closely loeated
and separated from the less-polluted sites. Comrnunities eolleeted from the
medium pollution in TKC formed small groups widely dispersed on the map,
while the less-polluted sampie sites were generally divided aeeording to
topographical eonditions. This indieated that the features of the input data from
ART were aeeordingly eonveyed to the Kohonen training. The reversed proeess,