

Chapter 8· Analysis of Stream Macroinvertebrate Communities
137
0
1
2
0 2630
2141 1932
76
3346
5060
1
38
25
2
6468
35
3
11
4
1628
37
53
1770
5
6
36
20
34
7
715
48
0
8 69
Intolerant species
o Lamprortus orientaUs ,
15 Ordobrevia sp.,
51 Dicrotendipes sp.2,
3
4
5
6
7
8
2956
4958 2224
4245
82
3152
6379 40
7778
83
8081
39
4375
27
65
23
3
74
44
810
6162
59
14
18
912
1366
55
567
6
14
51
5772
5471
247
73
Tolerant species
2 Limnodrilus hojfmeisteri,
7 Viviparidae sp.,
Rare
species
Abundant
species
47 Chironomus sp.,
48 Demicryptochironomus sp.l,
54 Micropsectra sp.,
57 Parachironomus sp.
69 Paraphaenocladius sp. 1, 70 Pseudoorthocladius sp. 2, 71 Rheocricotopus sp.
72 Synorthoccladius sp.,
73 Thienemannia sp.
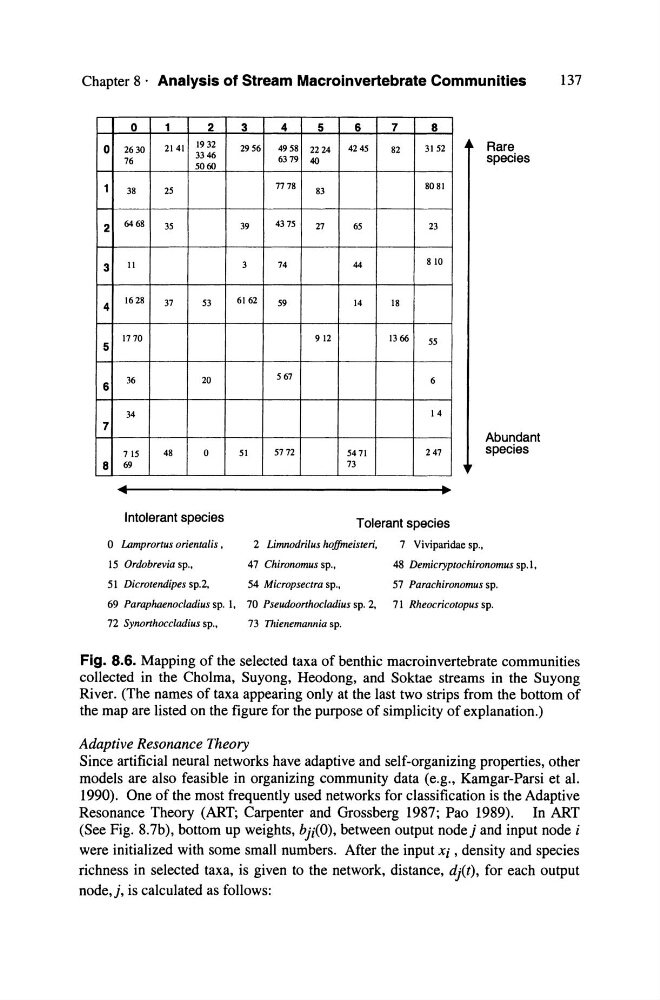
Fig. 8.6. Mapping of the selected taxa of benthic macroinvertebrate communities
collected in the Cholma, Suyong, Heodong, and Soktae streams in the Suyong
River. (The names of taxa appearing only at the last two strips from the bottom of
the map are listed on the figure for the purpose of simplicity of explanation.)
Adaptive Resonance Theory
Since artificial neural networks have adaptive and self-organizing properties, other
models are also feasible in organizing community data (e.g., Kamgar-Parsi et al.
1990). One of the most frequently used networks for classification is the Adaptive
Resonance Theory (ART; Carpenter and Grossberg 1987; Pao 1989). In ART
(See Fig. 8.7b), bottom up weights, bji(O), between output nodej and input node i
were initialized with some small numbers. After the input Xi , density and species
richness in selected taxa, is given to the network, distance, djCt), for each output
node, j, is calculated as folIows:
137
0
1
2
0 2630
2141 1932
76
3346
5060
1
38
25
2
6468
35
3
11
4
1628
37
53
1770
5
6
36
20
34
7
715
48
0
8 69
Intolerant species
o Lamprortus orientaUs ,
15 Ordobrevia sp.,
51 Dicrotendipes sp.2,
3
4
5
6
7
8
2956
4958 2224
4245
82
3152
6379 40
7778
83
8081
39
4375
27
65
23
3
74
44
810
6162
59
14
18
912
1366
55
567
6
14
51
5772
5471
247
73
Tolerant species
2 Limnodrilus hojfmeisteri,
7 Viviparidae sp.,
Rare
species
Abundant
species
47 Chironomus sp.,
48 Demicryptochironomus sp.l,
54 Micropsectra sp.,
57 Parachironomus sp.
69 Paraphaenocladius sp. 1, 70 Pseudoorthocladius sp. 2, 71 Rheocricotopus sp.
72 Synorthoccladius sp.,
73 Thienemannia sp.
Fig. 8.6. Mapping of the selected taxa of benthic macroinvertebrate communities
collected in the Cholma, Suyong, Heodong, and Soktae streams in the Suyong
River. (The names of taxa appearing only at the last two strips from the bottom of
the map are listed on the figure for the purpose of simplicity of explanation.)
Adaptive Resonance Theory
Since artificial neural networks have adaptive and self-organizing properties, other
models are also feasible in organizing community data (e.g., Kamgar-Parsi et al.
1990). One of the most frequently used networks for classification is the Adaptive
Resonance Theory (ART; Carpenter and Grossberg 1987; Pao 1989). In ART
(See Fig. 8.7b), bottom up weights, bji(O), between output nodej and input node i
were initialized with some small numbers. After the input Xi , density and species
richness in selected taxa, is given to the network, distance, djCt), for each output
node, j, is calculated as folIows: