

132
T.-S. Chon . Y.S. Park· I.-S. Kwak . E.Y. Cha
0
1
2
3
4
5
6
7
8
ST3SU
ST2SU
STiA
0
ST4A
ST4SP
ST2A
ST4W
ST4SU
ST3A
1
ST3SP
SY4W
STiSU
SY2A
2
ST2SP
SY5A
STIW
SYlA
3
ST3W
SY3A
SY4A
SYlSP
SY2SP
SY3SP
4
SY4SP
SY5SP
CM2W
CM2SU
SY2W
CM3SU
5
SY3W
CM4SU
SY5W
CM5SU
CM5A
CM1SU
SY5SU
6
SY2SU
7
SYlW
CM1SP
CM1A
CM1W
SY4SU
STlW
CM2A
CM2SP
CM3W
STlSP
SY1SU
CM3A
CM4W
8
SY3SU
CM3SP
CM4SP
CM4A
CM5W
CM5SP
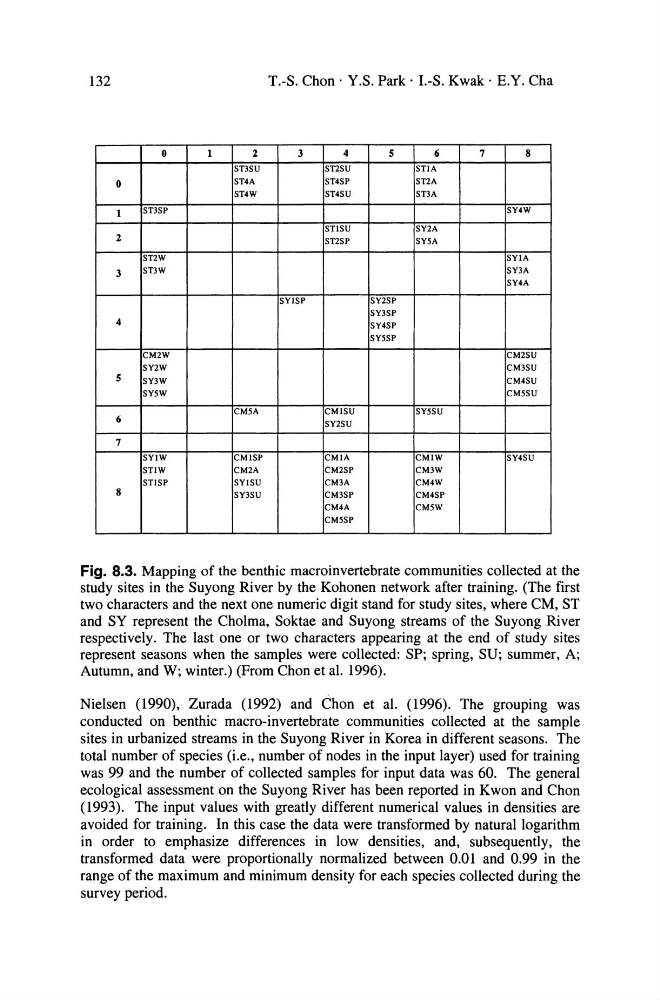
Fig. 8.3. Mapping of the benthic macroinvertebrate communities collected at the
study sites in the Suyong River by the Kohonen network after training. (The first
two characters and the next one numeric digit stand for study sites. where CM. ST
and SY represent the Cholma, Soktae and Suyong streams of the Suyong River
respectively. The last one or two characters appearing at the end of study sites
represent seasons when the sampIes were collected: SP; spring, SU; summer, A;
Autumn, and W; winter.) (From Chon et al. 1996).
Nielsen (1990), Zurada (1992) and Chon et al. (1996). The grouping was
conducted on benthic macro-invertebrate communities collected at the sampIe
sites in urbanized streams in the Suyong River in Korea in different seasons. The
total number of species (i.e .• number of nodes in the input layer) used for training
was 99 and the number of collected sampIes for input data was 60. The general
ecological assessment on the Suyong River has been reported in Kwon and Chon
(1993). The input values with greatly different numerical values in densities are
avoided for training. In this case the data were transformed by natural logarithm
in order to emphasize differences in low densities, and. subsequently, the
transformed data were proportionally normalized between 0.01 and 0.99 in the
range of the maximum and minimum density for each species collected during the
survey period.
T.-S. Chon . Y.S. Park· I.-S. Kwak . E.Y. Cha
0
1
2
3
4
5
6
7
8
ST3SU
ST2SU
STiA
0
ST4A
ST4SP
ST2A
ST4W
ST4SU
ST3A
1
ST3SP
SY4W
STiSU
SY2A
2
ST2SP
SY5A
STIW
SYlA
3
ST3W
SY3A
SY4A
SYlSP
SY2SP
SY3SP
4
SY4SP
SY5SP
CM2W
CM2SU
SY2W
CM3SU
5
SY3W
CM4SU
SY5W
CM5SU
CM5A
CM1SU
SY5SU
6
SY2SU
7
SYlW
CM1SP
CM1A
CM1W
SY4SU
STlW
CM2A
CM2SP
CM3W
STlSP
SY1SU
CM3A
CM4W
8
SY3SU
CM3SP
CM4SP
CM4A
CM5W
CM5SP
Fig. 8.3. Mapping of the benthic macroinvertebrate communities collected at the
study sites in the Suyong River by the Kohonen network after training. (The first
two characters and the next one numeric digit stand for study sites. where CM. ST
and SY represent the Cholma, Soktae and Suyong streams of the Suyong River
respectively. The last one or two characters appearing at the end of study sites
represent seasons when the sampIes were collected: SP; spring, SU; summer, A;
Autumn, and W; winter.) (From Chon et al. 1996).
Nielsen (1990), Zurada (1992) and Chon et al. (1996). The grouping was
conducted on benthic macro-invertebrate communities collected at the sampIe
sites in urbanized streams in the Suyong River in Korea in different seasons. The
total number of species (i.e .• number of nodes in the input layer) used for training
was 99 and the number of collected sampIes for input data was 60. The general
ecological assessment on the Suyong River has been reported in Kwon and Chon
(1993). The input values with greatly different numerical values in densities are
avoided for training. In this case the data were transformed by natural logarithm
in order to emphasize differences in low densities, and. subsequently, the
transformed data were proportionally normalized between 0.01 and 0.99 in the
range of the maximum and minimum density for each species collected during the
survey period.