

44
Ecosystem Characterization and Ecological Assessments
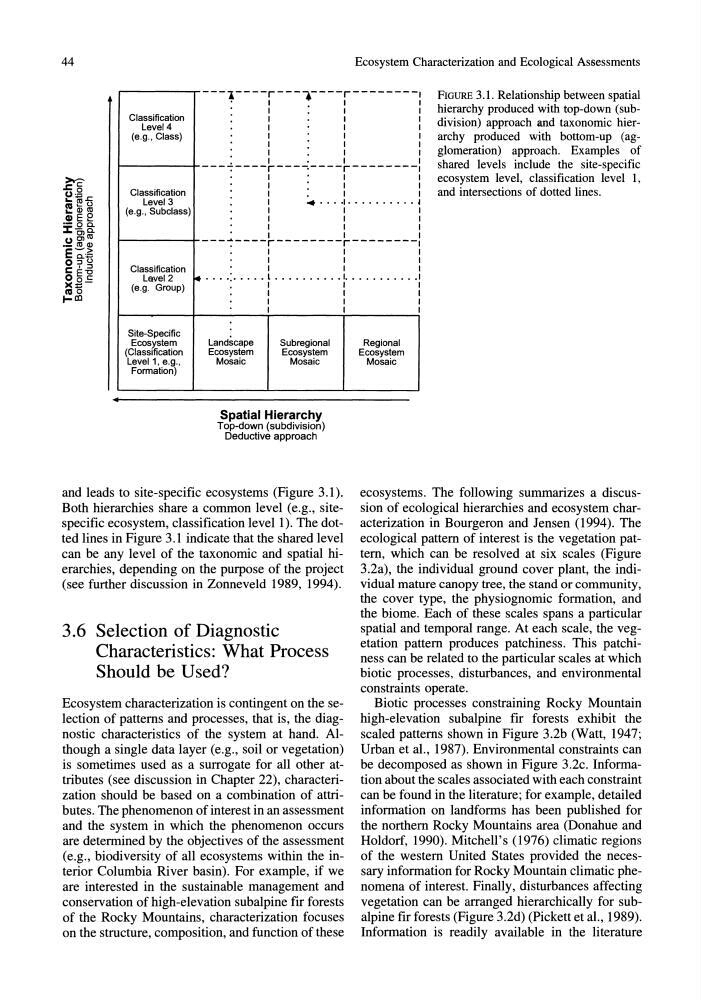
--r--T---·----:---------: FiGURE 3.l. Relationship between spatial
hierarchy produced with top-down (subdivision) approach and taxonomic hierarchy produced with bottom-up (agglomeration) approach. Examples of
shared levels include the site-specific
ecosystem level, classification levell,
and intersections of dotted lines.
.
I
.
I
I
Classification
Level 4
(e.g .• Class)
I
I
I
I
I
I
I
I
I
I
I
I
I
I
I
~--------+---~----~---~----~--------:
I
I
I
I
I
I
Classification
Level 3
(e.g., Subclass)
I
I
I
I
. . . . . . I . . . . . . . . . . j
I
I
I
I
I
I
I
I
I
~--------+---~---+--------~--------:
I
I
I
I
I
I
Classification
Lavel2
(e.g. Group)
I
I
I
4 · · · .: • . . . . : . . . . . . . . . . : . . . . . . . . . . . :
I
I
I
I
I
I
I
I
I
Site-Specific
Ecosystem
(Classification
Level 1, e.g.,
Formation)
Landscape
Ecosystem
Mosaic
Subregional
Ecosystem
Mosaic
Spatial Hierarchy
Top-down (subdivision)
Deductive approach
and leads to site-specific ecosystems (Figure 3.1).
Both hierarchies share a common level (e.g., sitespecific ecosystem, classification level 1). The dotted lines in Figure 3.1 indicate that the shared level
can be any level of the taxonomic and spatial hierarchies, depending on the purpose of the project
(see further discussion in Zonneveld 1989, 1994).
3.6 Selection of Diagnostic
Characteristics: What Process
Should be Used?
Ecosystem characterization is contingent on the selection of patterns and processes, that is, the diagnostic characteristics of the system at hand. Although a single data layer (e.g., soil or vegetation)
is sometimes used as a surrogate for all other attributes (see discussion in Chapter 22), characterization should be based on a combination of attributes. The phenomenon of interest in an assessment
and the system in which the phenomenon occurs
are determined by the objectives of the assessment
(e.g., biodiversity of all ecosystems within the interior Columbia River basin). For example, if we
are interested in the sustainable management and
conservation of high-elevation subalpine fir forests
of the Rocky Mountains, characterization focuses
on the structure, composition, and function of these
Regional
Ecosystem
Mosaic
ecosystems. The following summarizes a discussion of ecological hierarchies and ecosystem characterization in Bourgeron and Jensen (1994). The
ecological pattern of interest is the vegetation pattern, which can be resolved at six scales (Figure
3.2a), the individual ground cover plant, the individual mature canopy tree, the stand or community,
the cover type, the physiognomic formation, and
the biome. Each of these scales spans a particular
spatial and temporal range. At each scale, the vegetation pattern produces patchiness. This patchiness can be related to the particular scales at which
biotic processes, disturbances, and environmental
constraints operate.
Biotic processes constraining Rocky Mountain
high-elevation subalpine fir forests exhibit the
scaled patterns shown in Figure 3.2b (Watt, 1947;
Urban et aI., 1987). Environmental constraints can
be decomposed as shown in Figure 3.2c. Information about the scales associated with each constraint
can be found in the literature; for example, detailed
information on landforms has been published for
the northern Rocky Mountains area (Donahue and
Holdorf, 1990). Mitchell's (1976) climatic regions
of the western United States provided the necessary information for Rocky Mountain climatic phenomena of interest. Finally, disturbances affecting
vegetation can be arranged hierarchically for subalpine fir forests (Figure 3.2d) (Pickett et aI., 1989).
Information is readily available in the literature
Ecosystem Characterization and Ecological Assessments
--r--T---·----:---------: FiGURE 3.l. Relationship between spatial
hierarchy produced with top-down (subdivision) approach and taxonomic hierarchy produced with bottom-up (agglomeration) approach. Examples of
shared levels include the site-specific
ecosystem level, classification levell,
and intersections of dotted lines.
.
I
.
I
I
Classification
Level 4
(e.g .• Class)
I
I
I
I
I
I
I
I
I
I
I
I
I
I
I
~--------+---~----~---~----~--------:
I
I
I
I
I
I
Classification
Level 3
(e.g., Subclass)
I
I
I
I
. . . . . . I . . . . . . . . . . j
I
I
I
I
I
I
I
I
I
~--------+---~---+--------~--------:
I
I
I
I
I
I
Classification
Lavel2
(e.g. Group)
I
I
I
4 · · · .: • . . . . : . . . . . . . . . . : . . . . . . . . . . . :
I
I
I
I
I
I
I
I
I
Site-Specific
Ecosystem
(Classification
Level 1, e.g.,
Formation)
Landscape
Ecosystem
Mosaic
Subregional
Ecosystem
Mosaic
Spatial Hierarchy
Top-down (subdivision)
Deductive approach
and leads to site-specific ecosystems (Figure 3.1).
Both hierarchies share a common level (e.g., sitespecific ecosystem, classification level 1). The dotted lines in Figure 3.1 indicate that the shared level
can be any level of the taxonomic and spatial hierarchies, depending on the purpose of the project
(see further discussion in Zonneveld 1989, 1994).
3.6 Selection of Diagnostic
Characteristics: What Process
Should be Used?
Ecosystem characterization is contingent on the selection of patterns and processes, that is, the diagnostic characteristics of the system at hand. Although a single data layer (e.g., soil or vegetation)
is sometimes used as a surrogate for all other attributes (see discussion in Chapter 22), characterization should be based on a combination of attributes. The phenomenon of interest in an assessment
and the system in which the phenomenon occurs
are determined by the objectives of the assessment
(e.g., biodiversity of all ecosystems within the interior Columbia River basin). For example, if we
are interested in the sustainable management and
conservation of high-elevation subalpine fir forests
of the Rocky Mountains, characterization focuses
on the structure, composition, and function of these
Regional
Ecosystem
Mosaic
ecosystems. The following summarizes a discussion of ecological hierarchies and ecosystem characterization in Bourgeron and Jensen (1994). The
ecological pattern of interest is the vegetation pattern, which can be resolved at six scales (Figure
3.2a), the individual ground cover plant, the individual mature canopy tree, the stand or community,
the cover type, the physiognomic formation, and
the biome. Each of these scales spans a particular
spatial and temporal range. At each scale, the vegetation pattern produces patchiness. This patchiness can be related to the particular scales at which
biotic processes, disturbances, and environmental
constraints operate.
Biotic processes constraining Rocky Mountain
high-elevation subalpine fir forests exhibit the
scaled patterns shown in Figure 3.2b (Watt, 1947;
Urban et aI., 1987). Environmental constraints can
be decomposed as shown in Figure 3.2c. Information about the scales associated with each constraint
can be found in the literature; for example, detailed
information on landforms has been published for
the northern Rocky Mountains area (Donahue and
Holdorf, 1990). Mitchell's (1976) climatic regions
of the western United States provided the necessary information for Rocky Mountain climatic phenomena of interest. Finally, disturbances affecting
vegetation can be arranged hierarchically for subalpine fir forests (Figure 3.2d) (Pickett et aI., 1989).
Information is readily available in the literature