

34.3 Assessment Results
Agriculture
Alpine
Vegetation Class
Cold forest .!!I!!!!I!!!!I_
Cool shrub
Dry forest
Dry grass
Dry shrub
Moist forest
Riparian shrub
Riparian woodland
Rock
Urban
Water
Woodland
~--~--~----~--~--~
o
5
10
15
20
25
Percent
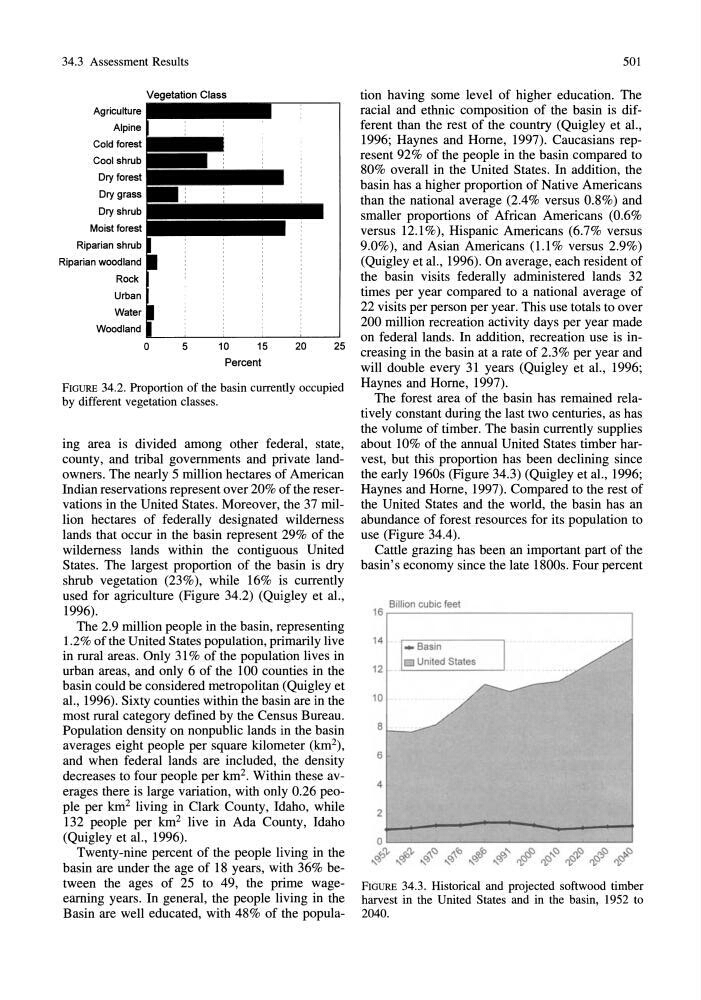
FIGURE 34.2. Proportion of the basin currently occupied
by different vegetation classes.
ing area is divided among other federal, state,
county, and tribal governments and private landowners. The nearly 5 million hectares of American
Indian reservations represent over 20% of the reservations in the United States. Moreover, the 37 million hectares of federally designated wilderness
lands that occur in the basin represent 29% of the
wilderness lands within the contiguous United
States. The largest proportion of the basin is dry
shrub vegetation (23%), while 16% is currently
used for agriculture (Figure 34.2) (Quigley et aI.,
1996).
The 2.9 million people in the basin, representing
1.2% of the United States population, primarily live
in rural areas. Only 31 % of the population lives in
urban areas, and only 6 of the 100 counties in the
basin could be considered metropolitan (Quigley et
al., 1996). Sixty counties within the basin are in the
most rural category defined by the Census Bureau.
Population density on nonpublic lands in the basin
averages eight people per square kilometer (km2),
and when federal lands are included, the density
decreases to four people per km 2 . Within these averages there is large variation, with only 0.26 people per km 2 living in Clark County, Idaho, while
132 people per km 2 live in Ada County, Idaho
(Quigley et aI., 1996).
Twenty-nine percent of the people living in the
basin are under the age of 18 years, with 36% between the ages of 25 to 49, the prime wageearning years. In general, the people living in the
Basin are well educated, with 48% of the popula501
tion having some level of higher education. The
racial and ethnic composition of the basin is different than the rest of the country (Quigley et al.,
1996; Haynes and Home, 1997). Caucasians represent 92% of the people in the basin compared to
80% overall in the United States. In addition, the
basin has a higher proportion of Native Americans
than the national average (2.4% versus 0.8%) and
smaller proportions of African Americans (0.6%
versus 12.1%), Hispanic Americans (6.7% versus
9.0%), and Asian Americans (1.1% versus 2.9%)
(Quigley et al., 1996). On average, each resident of
the basin visits federally administered lands 32
times per year compared to a national average of
22 visits per person per year. This use totals to over
200 million recreation activity days per year made
on federal lands. In addition, recreation use is increasing in the basin at a rate of 2.3% per year and
will double every 31 years (Quigley et aI., 1996;
Haynes and Home, 1997).
The forest area of the basin has remained relatively constant during the last two centuries, as has
the volume of timber. The basin currently supplies
about 10% of the annual United States timber harvest, but this proportion has been declining since
the early 1960s (Figure 34.3) (Quigley et aI., 1996;
Haynes and Home, 1997). Compared to the rest of
the United States and the world, the basin has an
abundance of forest resources for its population to
use (Figure 34.4).
Cattle grazing has been an important part of the
basin's economy since the late 1800s. Four percent
Billion cubic feet
16,--------------------------------,
14
12
10
8
6
4
2
FIGURE 34.3. Historical and projected softwood timber
harvest in the United States and in the basin, 1952 to
2040.
Agriculture
Alpine
Vegetation Class
Cold forest .!!I!!!!I!!!!I_
Cool shrub
Dry forest
Dry grass
Dry shrub
Moist forest
Riparian shrub
Riparian woodland
Rock
Urban
Water
Woodland
~--~--~----~--~--~
o
5
10
15
20
25
Percent
FIGURE 34.2. Proportion of the basin currently occupied
by different vegetation classes.
ing area is divided among other federal, state,
county, and tribal governments and private landowners. The nearly 5 million hectares of American
Indian reservations represent over 20% of the reservations in the United States. Moreover, the 37 million hectares of federally designated wilderness
lands that occur in the basin represent 29% of the
wilderness lands within the contiguous United
States. The largest proportion of the basin is dry
shrub vegetation (23%), while 16% is currently
used for agriculture (Figure 34.2) (Quigley et aI.,
1996).
The 2.9 million people in the basin, representing
1.2% of the United States population, primarily live
in rural areas. Only 31 % of the population lives in
urban areas, and only 6 of the 100 counties in the
basin could be considered metropolitan (Quigley et
al., 1996). Sixty counties within the basin are in the
most rural category defined by the Census Bureau.
Population density on nonpublic lands in the basin
averages eight people per square kilometer (km2),
and when federal lands are included, the density
decreases to four people per km 2 . Within these averages there is large variation, with only 0.26 people per km 2 living in Clark County, Idaho, while
132 people per km 2 live in Ada County, Idaho
(Quigley et aI., 1996).
Twenty-nine percent of the people living in the
basin are under the age of 18 years, with 36% between the ages of 25 to 49, the prime wageearning years. In general, the people living in the
Basin are well educated, with 48% of the popula501
tion having some level of higher education. The
racial and ethnic composition of the basin is different than the rest of the country (Quigley et al.,
1996; Haynes and Home, 1997). Caucasians represent 92% of the people in the basin compared to
80% overall in the United States. In addition, the
basin has a higher proportion of Native Americans
than the national average (2.4% versus 0.8%) and
smaller proportions of African Americans (0.6%
versus 12.1%), Hispanic Americans (6.7% versus
9.0%), and Asian Americans (1.1% versus 2.9%)
(Quigley et al., 1996). On average, each resident of
the basin visits federally administered lands 32
times per year compared to a national average of
22 visits per person per year. This use totals to over
200 million recreation activity days per year made
on federal lands. In addition, recreation use is increasing in the basin at a rate of 2.3% per year and
will double every 31 years (Quigley et aI., 1996;
Haynes and Home, 1997).
The forest area of the basin has remained relatively constant during the last two centuries, as has
the volume of timber. The basin currently supplies
about 10% of the annual United States timber harvest, but this proportion has been declining since
the early 1960s (Figure 34.3) (Quigley et aI., 1996;
Haynes and Home, 1997). Compared to the rest of
the United States and the world, the basin has an
abundance of forest resources for its population to
use (Figure 34.4).
Cattle grazing has been an important part of the
basin's economy since the late 1800s. Four percent
Billion cubic feet
16,--------------------------------,
14
12
10
8
6
4
2
FIGURE 34.3. Historical and projected softwood timber
harvest in the United States and in the basin, 1952 to
2040.