

32.6 Major Types of Analysis
Kentucky
Georgia
We t Virginia
High
Medium
D
Low
483
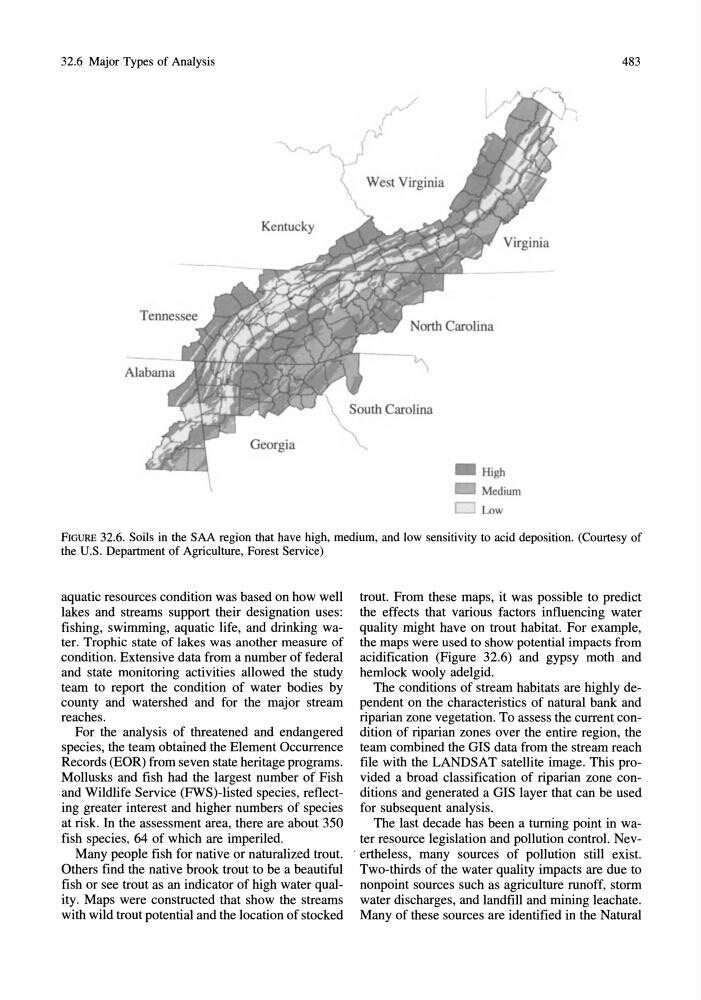
FIGURE 32.6. Soils in the SAA region that have high, medium, and low sensitivity to acid deposition. (Courtesy of
the U.S. Department of Agriculture, Forest Service)
aquatic resources condition was based on how well
lakes and streams support their designation uses:
fishing, swimming, aquatic life, and drinking water. Trophic state of lakes was another measure of
condition. Extensive data from a number of federal
and state monitoring activities allowed the study
team to report the condition of water bodies by
county and watershed and for the major stream
reaches.
For the analysis of threatened and endangered
species, the team obtained the Element Occurrence
Records (EaR) from seven state heritage programs.
Mollusks and fish had the largest number of Fish
and Wildlife Service (FWS)-listed species, reflecting greater interest and higher numbers of species
at risk. In the assessment area, there are about 350
fish species, 64 of which are imperiled.
Many people fish for native or naturalized trout.
Others find the native brook trout to be a beautiful
fish or see trout as an indicator of high water quality. Maps were constructed that show the streams
with wild trout potential and the location of stocked
trout. From these maps, it was possible to predict
the effects that various factors influencing water
quality might have on trout habitat. For example,
the maps were used to show potential impacts from
acidification (Figure 32.6) and gypsy moth and
hemlock wooly ade1gid.
The conditions of stream habitats are highly dependent on the characteristics of natural bank and
riparian zone vegetation. To assess the current condition of riparian zones over the entire region, the
team combined the GIS data from the stream reach
file with the LANDSAT satellite image. This provided a broad classification of riparian zone conditions and generated a GIS layer that can be used
for subsequent analysis.
The last decade has been a turning point in water resource legislation and pollution control. Nev. ertheless, many sources of pollution still exist.
Two-thirds of the water quality impacts are due to
nonpoint sources such as agriculture runoff, storm
water discharges, and landfill and mining leachate.
Many of these sources are identified in the Natural
Kentucky
Georgia
We t Virginia
High
Medium
D
Low
483
FIGURE 32.6. Soils in the SAA region that have high, medium, and low sensitivity to acid deposition. (Courtesy of
the U.S. Department of Agriculture, Forest Service)
aquatic resources condition was based on how well
lakes and streams support their designation uses:
fishing, swimming, aquatic life, and drinking water. Trophic state of lakes was another measure of
condition. Extensive data from a number of federal
and state monitoring activities allowed the study
team to report the condition of water bodies by
county and watershed and for the major stream
reaches.
For the analysis of threatened and endangered
species, the team obtained the Element Occurrence
Records (EaR) from seven state heritage programs.
Mollusks and fish had the largest number of Fish
and Wildlife Service (FWS)-listed species, reflecting greater interest and higher numbers of species
at risk. In the assessment area, there are about 350
fish species, 64 of which are imperiled.
Many people fish for native or naturalized trout.
Others find the native brook trout to be a beautiful
fish or see trout as an indicator of high water quality. Maps were constructed that show the streams
with wild trout potential and the location of stocked
trout. From these maps, it was possible to predict
the effects that various factors influencing water
quality might have on trout habitat. For example,
the maps were used to show potential impacts from
acidification (Figure 32.6) and gypsy moth and
hemlock wooly ade1gid.
The conditions of stream habitats are highly dependent on the characteristics of natural bank and
riparian zone vegetation. To assess the current condition of riparian zones over the entire region, the
team combined the GIS data from the stream reach
file with the LANDSAT satellite image. This provided a broad classification of riparian zone conditions and generated a GIS layer that can be used
for subsequent analysis.
The last decade has been a turning point in water resource legislation and pollution control. Nev. ertheless, many sources of pollution still exist.
Two-thirds of the water quality impacts are due to
nonpoint sources such as agriculture runoff, storm
water discharges, and landfill and mining leachate.
Many of these sources are identified in the Natural