

30.7 Major Results
50~==;===~~----------------~
40
~30+---------------~;
'5
j20+---10
o
Pines
Maple-beech
Aspen-birch
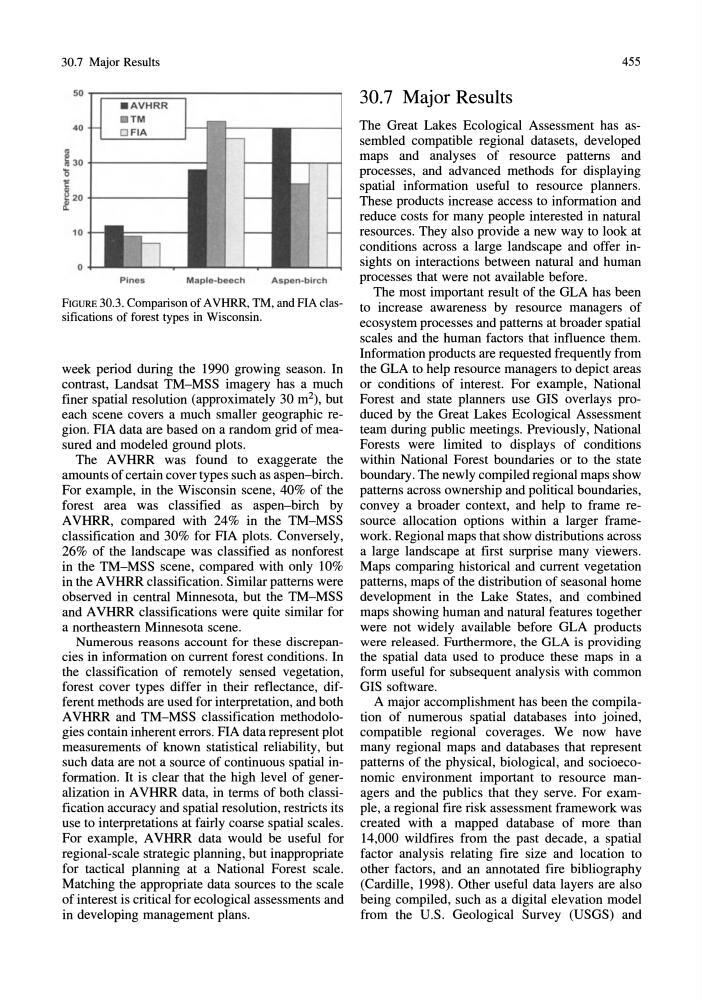
FIGURE 30.3. Comparison of A VHRR, TM, and PIA classifications of forest types in Wisconsin.
week period during the 1990 growing season. In
contrast, Landsat TM-MSS imagery has a much
finer spatial resolution (approximately 30 m 2 ), but
each scene covers a much smaller geographic region. FIA data are based on a random grid of measured and modeled ground plots.
The A VHRR was found to exaggerate the
amounts of certain cover types such as aspen-birch.
For example, in the Wisconsin scene, 40% of the
forest area was classified as aspen-birch by
A VHRR, compared with 24% in the TM-MSS
classification and 30% for FIA plots. Conversely,
26% of the landscape was classified as nonforest
in the TM-MSS scene, compared with only 10%
in the A VHRR classification. Similar patterns were
observed in central Minnesota, but the TM-MSS
and A VHRR classifications were quite similar for
a northeastern Minnesota scene.
Numerous reasons account for these discrepancies in information on current forest conditions. In
the classification of remotely sensed vegetation,
forest cover types differ in their reflectance, different methods are used for interpretation, and both
A VHRR and TM-MSS classification methodologies contain inherent errors. FIA data represent plot
measurements of known statistical reliability, but
such data are not a source of continuous spatial information. It is clear that the high level of generalization in A VHRR data, in terms of both classification accuracy and spatial resolution, restricts its
use to interpretations at fairly coarse spatial scales.
For example, A VHRR data would be useful for
regional-scale strategic planning, but inappropriate
for tactical planning at a National Forest scale.
Matching the appropriate data sources to the scale
of interest is critical for ecological assessments and
in developing management plans.
455
30_7 Major Results
The Great Lakes Ecological Assessment has assembled compatible regional datasets, developed
maps and analyses of resource patterns and
processes, and advanced methods for displaying
spatial information useful to resource planners.
These products increase access to information and
reduce costs for many people interested in natural
resources. They also provide a new way to look at
conditions across a large landscape and offer insights on interactions between natural and human
processes that were not available before.
The most important result of the GLA has been
to increase awareness by resource managers of
ecosystem processes and patterns at broader spatial
scales and the human factors that influence them.
Information products are requested frequently from
the GLA to help resource managers to depict areas
or conditions of interest. For example, National
Forest and state planners use GIS overlays produced by the Great Lakes Ecological Assessment
team during public meetings. Previously, National
Forests were limited to displays of conditions
within National Forest boundaries or to the state
boundary. The newly compiled regional maps show
patterns across ownership and political boundaries,
convey a broader context, and help to frame resource allocation options within a larger framework. Regional maps that show distributions across
a large landscape at first surprise many viewers.
Maps comparing historical and current vegetation
patterns, maps of the distribution of seasonal home
development in the Lake States, and combined
maps showing human and natural features together
were not widely available before GLA products
were released. Furthermore, the GLA is providing
the spatial data used to produce these maps in a
form useful for subsequent analysis with common
GIS software.
A major accomplishment has been the compilation of numerous spatial databases into joined,
compatible regional coverages. We now have
many regional maps and databases that represent
patterns of the physical, biological, and socioeconomic environment important to resource managers and the publics that they serve. For example, a regional fire risk assessment framework was
created with a mapped database of more than
14,000 wildfires from the past decade, a spatial
factor analysis relating fire size and location to
other factors, and an annotated fire bibliography
(Cardille, 1998). Other useful data layers are also
being compiled, such as a digital elevation model
from the U.S. Geological Survey (USGS) and
50~==;===~~----------------~
40
~30+---------------~;
'5
j20+---10
o
Pines
Maple-beech
Aspen-birch
FIGURE 30.3. Comparison of A VHRR, TM, and PIA classifications of forest types in Wisconsin.
week period during the 1990 growing season. In
contrast, Landsat TM-MSS imagery has a much
finer spatial resolution (approximately 30 m 2 ), but
each scene covers a much smaller geographic region. FIA data are based on a random grid of measured and modeled ground plots.
The A VHRR was found to exaggerate the
amounts of certain cover types such as aspen-birch.
For example, in the Wisconsin scene, 40% of the
forest area was classified as aspen-birch by
A VHRR, compared with 24% in the TM-MSS
classification and 30% for FIA plots. Conversely,
26% of the landscape was classified as nonforest
in the TM-MSS scene, compared with only 10%
in the A VHRR classification. Similar patterns were
observed in central Minnesota, but the TM-MSS
and A VHRR classifications were quite similar for
a northeastern Minnesota scene.
Numerous reasons account for these discrepancies in information on current forest conditions. In
the classification of remotely sensed vegetation,
forest cover types differ in their reflectance, different methods are used for interpretation, and both
A VHRR and TM-MSS classification methodologies contain inherent errors. FIA data represent plot
measurements of known statistical reliability, but
such data are not a source of continuous spatial information. It is clear that the high level of generalization in A VHRR data, in terms of both classification accuracy and spatial resolution, restricts its
use to interpretations at fairly coarse spatial scales.
For example, A VHRR data would be useful for
regional-scale strategic planning, but inappropriate
for tactical planning at a National Forest scale.
Matching the appropriate data sources to the scale
of interest is critical for ecological assessments and
in developing management plans.
455
30_7 Major Results
The Great Lakes Ecological Assessment has assembled compatible regional datasets, developed
maps and analyses of resource patterns and
processes, and advanced methods for displaying
spatial information useful to resource planners.
These products increase access to information and
reduce costs for many people interested in natural
resources. They also provide a new way to look at
conditions across a large landscape and offer insights on interactions between natural and human
processes that were not available before.
The most important result of the GLA has been
to increase awareness by resource managers of
ecosystem processes and patterns at broader spatial
scales and the human factors that influence them.
Information products are requested frequently from
the GLA to help resource managers to depict areas
or conditions of interest. For example, National
Forest and state planners use GIS overlays produced by the Great Lakes Ecological Assessment
team during public meetings. Previously, National
Forests were limited to displays of conditions
within National Forest boundaries or to the state
boundary. The newly compiled regional maps show
patterns across ownership and political boundaries,
convey a broader context, and help to frame resource allocation options within a larger framework. Regional maps that show distributions across
a large landscape at first surprise many viewers.
Maps comparing historical and current vegetation
patterns, maps of the distribution of seasonal home
development in the Lake States, and combined
maps showing human and natural features together
were not widely available before GLA products
were released. Furthermore, the GLA is providing
the spatial data used to produce these maps in a
form useful for subsequent analysis with common
GIS software.
A major accomplishment has been the compilation of numerous spatial databases into joined,
compatible regional coverages. We now have
many regional maps and databases that represent
patterns of the physical, biological, and socioeconomic environment important to resource managers and the publics that they serve. For example, a regional fire risk assessment framework was
created with a mapped database of more than
14,000 wildfires from the past decade, a spatial
factor analysis relating fire size and location to
other factors, and an annotated fire bibliography
(Cardille, 1998). Other useful data layers are also
being compiled, such as a digital elevation model
from the U.S. Geological Survey (USGS) and