

454
The Great Lakes Ecological Assessment
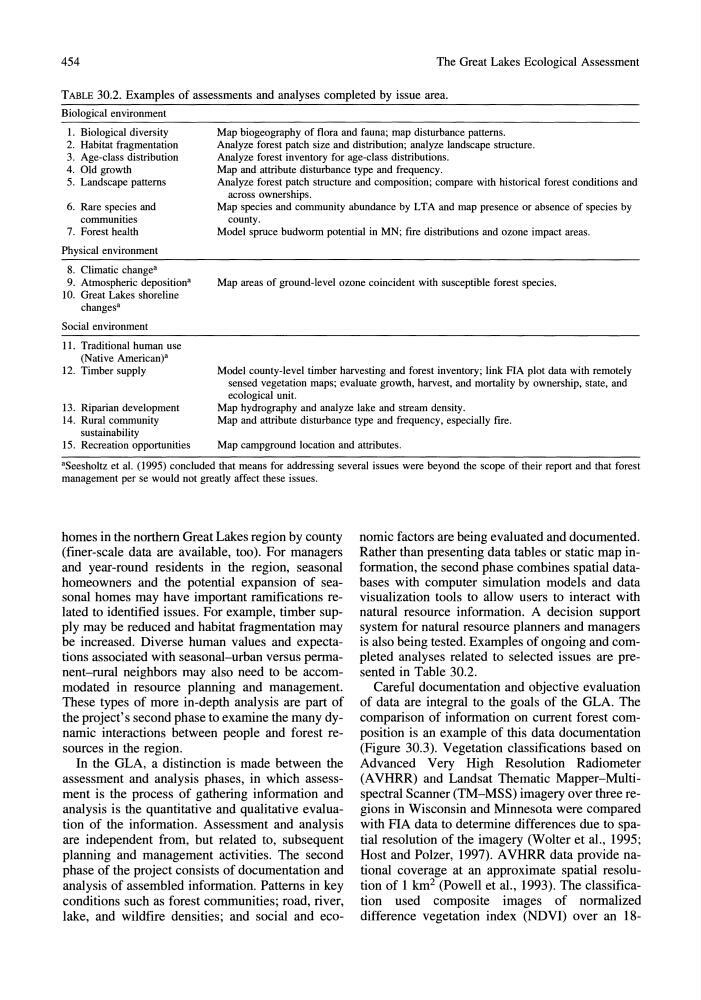
TABLE 30.2. Examples of assessments and analyses completed by issue area.
Biological environment
1. Biological diversity
2. Habitat fragmentation
3. Age-class distribution
Map biogeography of flora and fauna; map disturbance patterns.
Analyze forest patch size and distribution; analyze landscape structure.
Analyze forest inventory for age-class distributions.
4. Old growth
Map and attribute disturbance type and frequency.
5. Landscape patterns
Analyze forest patch structure and composition; compare with historical forest conditions and
across ownerships.
6. Rare species and
communities
Map species and community abundance by L T A and map presence or absence of species by
county.
7. Forest health
Model spruce budworm potential in MN; fire distributions and ozone impact areas.
Physical environment
8. Climatic change a
9. Atmospheric deposition a
Map areas of ground-level ozone coincident with susceptible forest species.
10. Great Lakes shoreline
changes a
Social environment
11. Traditional human use
(Native American)a
12. Timber supply
Model county-level timber harvesting and forest inventory; link FIA plot data with remotely
sensed vegetation maps; evaluate growth, harvest, and mortality by ownership, state, and
ecological unit.
13. Riparian development
Map hydrography and analyze lake and stream density.
14. Rural community
sustainability
Map and attribute disturbance type and frequency, especially fire.
15. Recreation opportunities
Map campground location and attributes.
aSeesholtz et al. (1995) concluded that means for addressing several issues were beyond the scope of their report and that forest
management per se would not greatly affect these issues.
homes in the northern Great Lakes region by county
(finer-scale data are available, too). For managers
and year-round residents in the region, seasonal
homeowners and the potential expansion of seasonal homes may have important ramifications related to identified issues. For example, timber supply may be reduced and habitat fragmentation may
be increased. Diverse human values and expectations associated with seasonal-urban versus permanent-rural neighbors may also need to be accommodated in resource planning and management.
These types of more in-depth analysis are part of
the project's second phase to examine the many dynamic interactions between people and forest resources in the region.
In the GLA, a distinction is made between the
assessment and analysis phases, in which assessment is the process of gathering information and
analysis is the quantitative and qualitative evaluation of the information. Assessment and analysis
are independent from, but related to, subsequent
planning and management activities. The second
phase of the project consists of documentation and
analysis of assembled information. Patterns in key
conditions such as forest communities; road, river,
lake, and wildfire densities; and social and economic factors are being evaluated and documented.
Rather than presenting data tables or static map information, the second phase combines spatial databases with computer simulation models and data
visualization tools to allow users to interact with
natural resource information. A decision support
system for natural resource planners and managers
is also being tested. Examples of ongoing and completed analyses related to selected issues are presented in Table 30.2.
Careful documentation and objective evaluation
of data are integral to the goals of the GLA. The
comparison of information on current forest composition is an example of this data documentation
(Figure 30.3). Vegetation classifications based on
Advanced Very High Resolution Radiometer
(AVHRR) and Landsat Thematic Mapper-Multispectral Scanner (TM-MSS) imagery over three regions in Wisconsin and Minnesota were compared
with PIA data to determine differences due to spatial resolution of the imagery (Wolter et aI., 1995;
Host and Polzer, 1997). AVHRR data provide national coverage at an approximate spatial resolution of 1 km 2 (Powell et al., 1993). The classification used composite images of normalized
difference vegetation index (NDVI) over an 18-
The Great Lakes Ecological Assessment
TABLE 30.2. Examples of assessments and analyses completed by issue area.
Biological environment
1. Biological diversity
2. Habitat fragmentation
3. Age-class distribution
Map biogeography of flora and fauna; map disturbance patterns.
Analyze forest patch size and distribution; analyze landscape structure.
Analyze forest inventory for age-class distributions.
4. Old growth
Map and attribute disturbance type and frequency.
5. Landscape patterns
Analyze forest patch structure and composition; compare with historical forest conditions and
across ownerships.
6. Rare species and
communities
Map species and community abundance by L T A and map presence or absence of species by
county.
7. Forest health
Model spruce budworm potential in MN; fire distributions and ozone impact areas.
Physical environment
8. Climatic change a
9. Atmospheric deposition a
Map areas of ground-level ozone coincident with susceptible forest species.
10. Great Lakes shoreline
changes a
Social environment
11. Traditional human use
(Native American)a
12. Timber supply
Model county-level timber harvesting and forest inventory; link FIA plot data with remotely
sensed vegetation maps; evaluate growth, harvest, and mortality by ownership, state, and
ecological unit.
13. Riparian development
Map hydrography and analyze lake and stream density.
14. Rural community
sustainability
Map and attribute disturbance type and frequency, especially fire.
15. Recreation opportunities
Map campground location and attributes.
aSeesholtz et al. (1995) concluded that means for addressing several issues were beyond the scope of their report and that forest
management per se would not greatly affect these issues.
homes in the northern Great Lakes region by county
(finer-scale data are available, too). For managers
and year-round residents in the region, seasonal
homeowners and the potential expansion of seasonal homes may have important ramifications related to identified issues. For example, timber supply may be reduced and habitat fragmentation may
be increased. Diverse human values and expectations associated with seasonal-urban versus permanent-rural neighbors may also need to be accommodated in resource planning and management.
These types of more in-depth analysis are part of
the project's second phase to examine the many dynamic interactions between people and forest resources in the region.
In the GLA, a distinction is made between the
assessment and analysis phases, in which assessment is the process of gathering information and
analysis is the quantitative and qualitative evaluation of the information. Assessment and analysis
are independent from, but related to, subsequent
planning and management activities. The second
phase of the project consists of documentation and
analysis of assembled information. Patterns in key
conditions such as forest communities; road, river,
lake, and wildfire densities; and social and economic factors are being evaluated and documented.
Rather than presenting data tables or static map information, the second phase combines spatial databases with computer simulation models and data
visualization tools to allow users to interact with
natural resource information. A decision support
system for natural resource planners and managers
is also being tested. Examples of ongoing and completed analyses related to selected issues are presented in Table 30.2.
Careful documentation and objective evaluation
of data are integral to the goals of the GLA. The
comparison of information on current forest composition is an example of this data documentation
(Figure 30.3). Vegetation classifications based on
Advanced Very High Resolution Radiometer
(AVHRR) and Landsat Thematic Mapper-Multispectral Scanner (TM-MSS) imagery over three regions in Wisconsin and Minnesota were compared
with PIA data to determine differences due to spatial resolution of the imagery (Wolter et aI., 1995;
Host and Polzer, 1997). AVHRR data provide national coverage at an approximate spatial resolution of 1 km 2 (Powell et al., 1993). The classification used composite images of normalized
difference vegetation index (NDVI) over an 18-