

29.4 Results and Discussion
Impact on
Bull Trout
Level of Impact on
Spawning and Rearing
Stream from Human Use
Intensity Model
HIGH
LOW
=
a E: Zero Roads
or Trails or People
Living within I km
Bull Trout Absent
or Migration Only
441
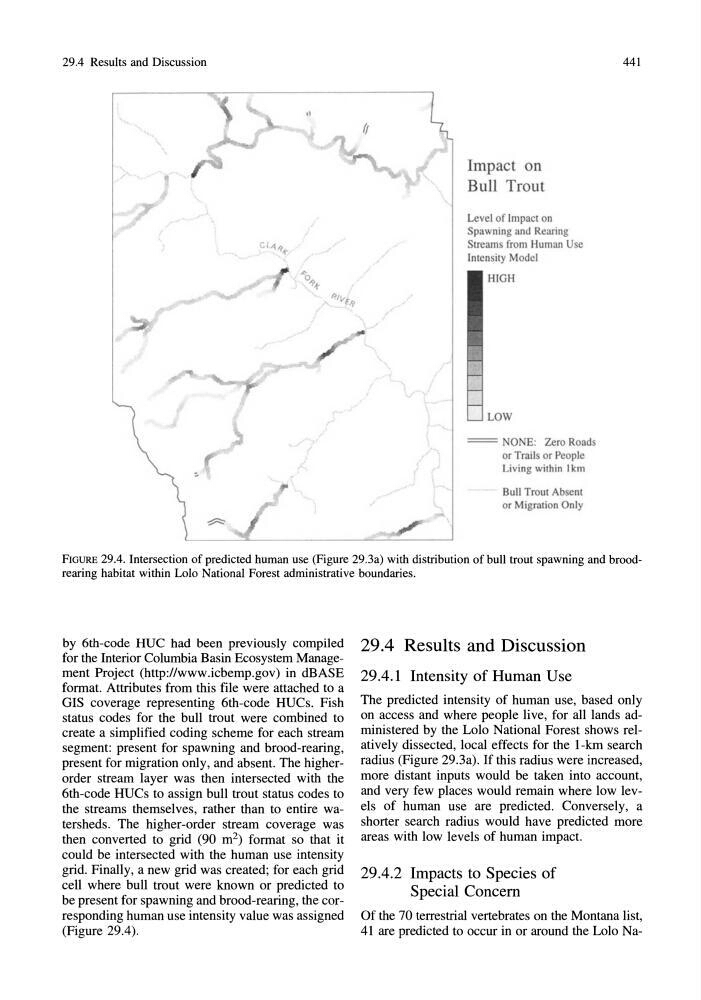
FiGURE 29.4. Intersection of predicted human use (Figure 29.3a) with distribution of bull trout spawning and broodrearing habitat within Lolo National Forest administrative boundaries.
by 6th-code HUC had been previously compiled
for the Interior Columbia Basin Ecosystem Management Project (http://www.icbemp.gov) in dBASE
format. Attributes from this file were attached to a
GIS coverage representing 6th-code HUCs. Fish
status codes for the bull trout were combined to
create a simplified coding scheme for each stream
segment: present for spawning and brood-rearing,
present for migration only, and absent. The higherorder stream layer was then intersected with the
6th-code HUCs to assign bull trout status codes to
the streams themselves, rather than to entire watersheds. The higher-order stream coverage was
then converted to grid (90 m 2 ) format so that it
could be intersected with the human use intensity
grid. Finally, a new grid was created; for each grid
cell where bull trout were known or predicted to
be present for spawning and brood-rearing, the corresponding human use intensity value was assigned
(Figure 29.4).
29.4 Results and Discussion
29.4.1 Intensity of Human Use
The predicted intensity of human use, based only
on access and where people live, for all lands administered by the Lolo National Forest shows relatively dissected, local effects for the I-kIn search
radius (Figure 29.3a). If this radius were increased,
more distant inputs would be taken into account,
and very few places would remain where low levels of human use are predicted. Conversely, a
shorter search radius would have predicted more
areas with low levels of human impact.
29.4.2 Impacts to Species of
Special Concern
Of the 70 terrestrial vertebrates on the Montana list,
41 are predicted to occur in or around the Lolo Na-
Impact on
Bull Trout
Level of Impact on
Spawning and Rearing
Stream from Human Use
Intensity Model
HIGH
LOW
=
a E: Zero Roads
or Trails or People
Living within I km
Bull Trout Absent
or Migration Only
441
FiGURE 29.4. Intersection of predicted human use (Figure 29.3a) with distribution of bull trout spawning and broodrearing habitat within Lolo National Forest administrative boundaries.
by 6th-code HUC had been previously compiled
for the Interior Columbia Basin Ecosystem Management Project (http://www.icbemp.gov) in dBASE
format. Attributes from this file were attached to a
GIS coverage representing 6th-code HUCs. Fish
status codes for the bull trout were combined to
create a simplified coding scheme for each stream
segment: present for spawning and brood-rearing,
present for migration only, and absent. The higherorder stream layer was then intersected with the
6th-code HUCs to assign bull trout status codes to
the streams themselves, rather than to entire watersheds. The higher-order stream coverage was
then converted to grid (90 m 2 ) format so that it
could be intersected with the human use intensity
grid. Finally, a new grid was created; for each grid
cell where bull trout were known or predicted to
be present for spawning and brood-rearing, the corresponding human use intensity value was assigned
(Figure 29.4).
29.4 Results and Discussion
29.4.1 Intensity of Human Use
The predicted intensity of human use, based only
on access and where people live, for all lands administered by the Lolo National Forest shows relatively dissected, local effects for the I-kIn search
radius (Figure 29.3a). If this radius were increased,
more distant inputs would be taken into account,
and very few places would remain where low levels of human use are predicted. Conversely, a
shorter search radius would have predicted more
areas with low levels of human impact.
29.4.2 Impacts to Species of
Special Concern
Of the 70 terrestrial vertebrates on the Montana list,
41 are predicted to occur in or around the Lolo Na-